本页未翻译。您正在浏览的是英文版本。
We’ve concluded another year around the sun. What did it look like in terms of solar irradiation?
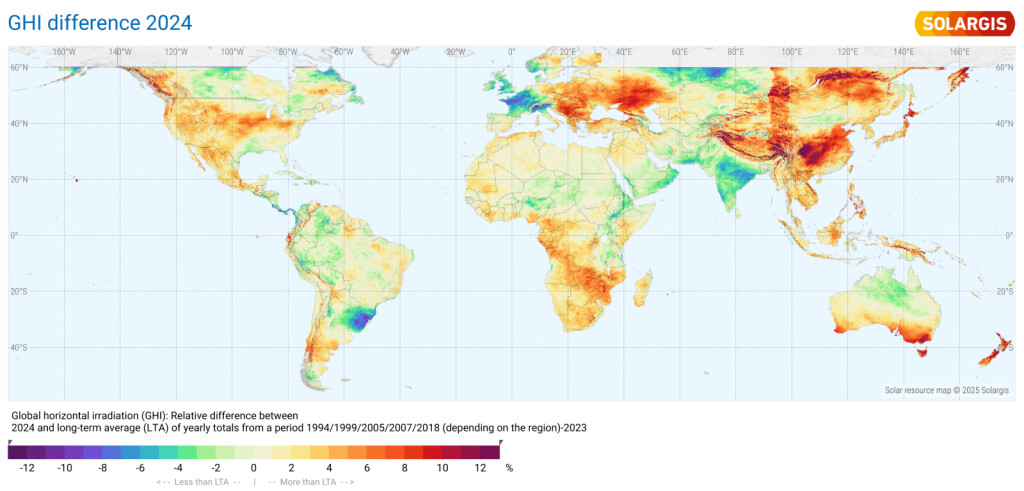
We conducted our yearly analysis of global horizontal irradiation (GHI) and evaluated the difference for 2024 from the long-term average (LTA). Our findings reveal notable decreases and increases in solar irradiation across the globe, while GHI in other regions oscillated around the long-term average.
The regional patterns are presented on the map below, showing the 2024 difference of GHI from the long-term average.
Let’s look at some of the selected regions in more detail.
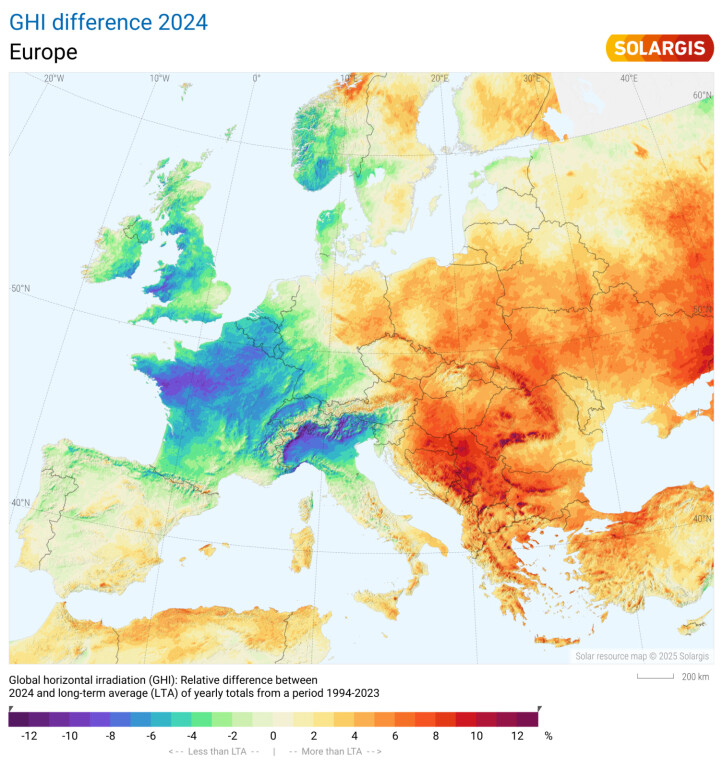
In 2024, France, Belgium and northern Italy experienced a decline in solar irradiation and notable deviations in weather patterns, regionally reduced by 10% compared to typical years. Most of the UK, southern Norway, and Denmark also experienced below-average solar irradiation. In contrast, much of eastern Europe enjoyed higher-than-average solar irradiation, particularly in the Balkan countries, where GHI anomalies locally exceeded 10%.
France faced other weather extremes alongside record-breaking low solar irradiation. Hurricane Kirk brought record rainfall across Western Europe, hitting France hard in early October, leading to widespread flooding and disruptions in the country.
The reduced solar irradiation levels in France were likely caused by increased cloud cover from large frontal cyclones. These factors can diminish the amount of sunlight reaching solar panels, impacting solar energy production.
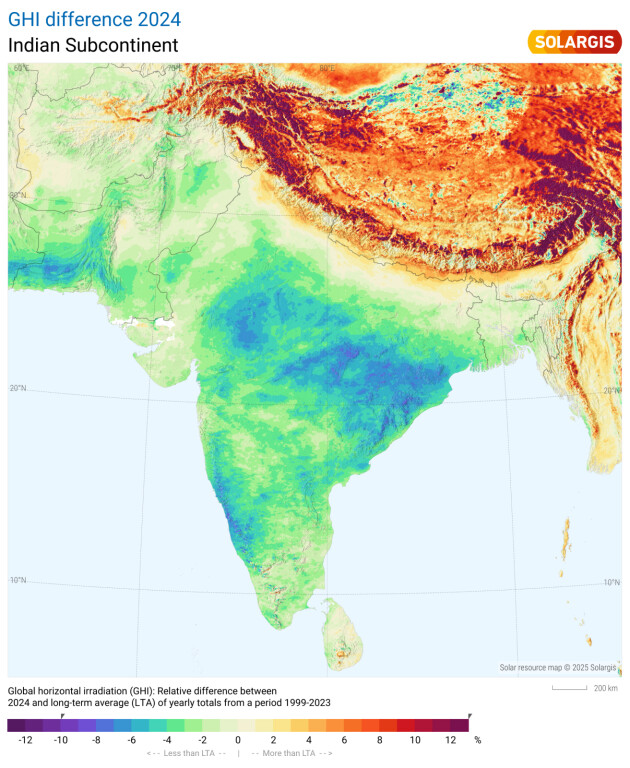
In 2024, most of India experienced a decline in solar irradiation by 3% to 10%, marking another year below average. India’s 2024 monsoon season was one of the wettest in recent years, with rainfall exceeding the long-term average (LTA) by nearly 8%. While this was beneficial for agriculture and water reservoirs, it posed significant challenges for solar energy production.
Increased cloud cover, prolonged rainy periods, and extreme weather events reduced the availability of sunlight, particularly in regions like Central India and the Western Ghats. Regions such as Gujarat and Maharashtra – key hubs for solar power – experienced extended periods of below-average irradiation due to persistent cloud cover.
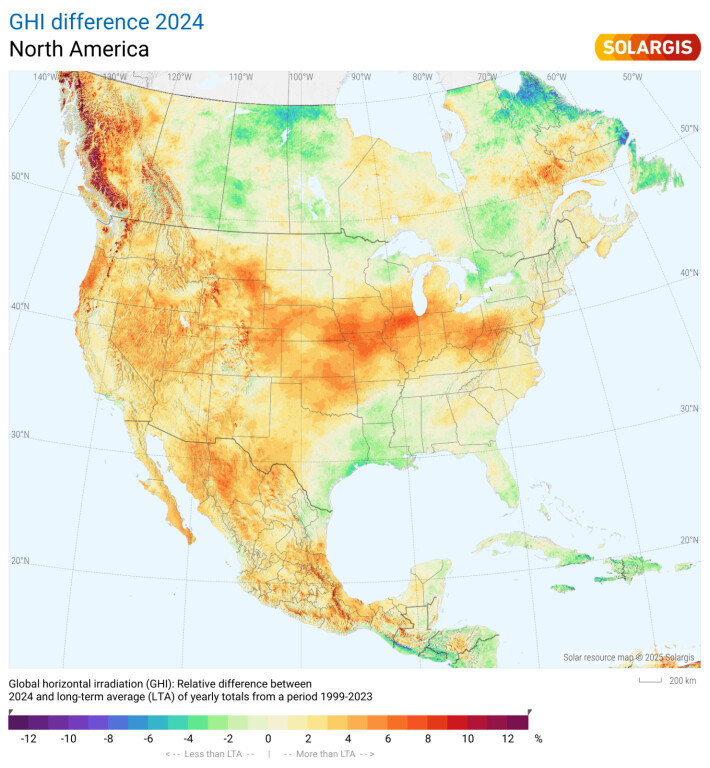
In 2024, the United States experienced notable weather extremes that significantly impacted solar irradiation across various regions. We’ve noted particularly intense solar irradiation in the Midwest and Northeast regions, including the Great Lakes area, all areas with typically moderate weather. An extreme heatwave hit states like Illinois, Iowa, Wisconsin, Indiana, Michigan, Missouri, and Ohio.
Other regions of the United States also faced extreme weather events, including wildfires in Southern California and late-season snow in the northern Rocky Mountains, highlighting the diverse climate challenges across the country. The Atlantic hurricane season was also notably active. Hurricane Milton caused landfall in Florida, producing severe tornadoes and causing extensive damage, including damage to PV system arrays.
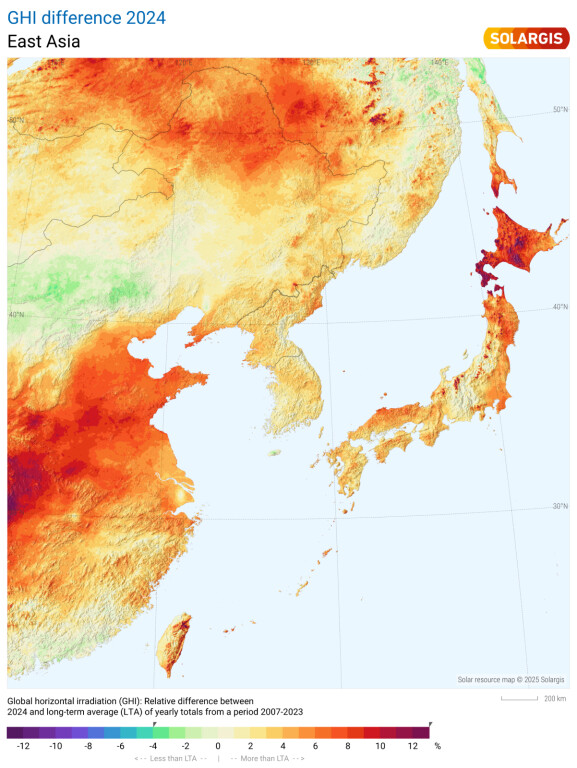
In 2024, Japan experienced notable deviations in weather patterns compared to typical years, alongside significant environmental events that impacted solar irradiation. Our data show that northern regions of Japan, particularly the island of Hokkaido, experienced over 10% higher-than-average solar irradiation in 2024.
This increase was observed across the country, suggesting a nationwide trend. Contributing factors may include variations in cloud cover, atmospheric conditions, and other meteorological elements that influence solar irradiation.
Another anomaly was the delayed snowfall on Mount Fuji. The iconic peak received its first snow cap on November 7, 2024, which is the latest in 130 years. This delay is attributed to unusually warm weather, with October temperatures at the summit averaging 1.6°C, compared to the typical -2°C.
In Australia, just like in Canada and the US, people suffered from heat waves, floods, droughts and wildfires.
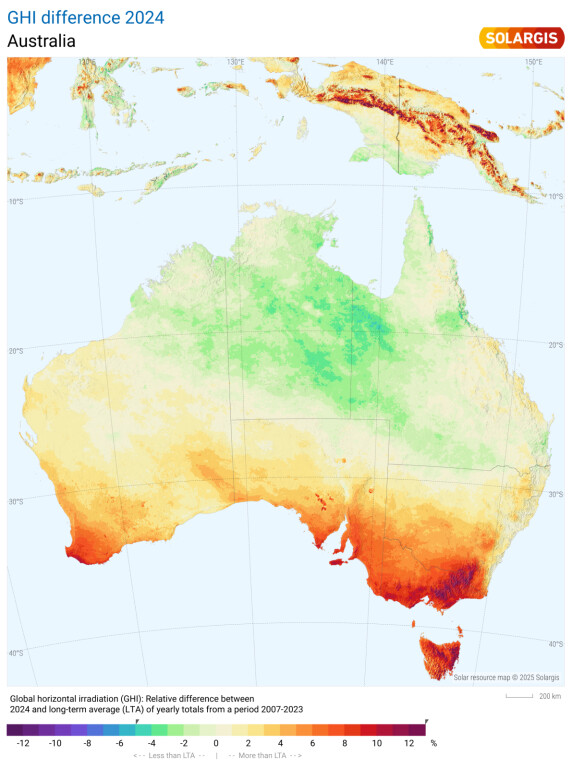
Regarding the amount of solar irradiation, our 2024 data show that Australia experienced notable deviations from typical weather patterns, particularly in the southern regions, including Melbourne, Perth and Tasmania. These areas recorded 8% to 12% higher-than-average solar irradiation.
In 2024, Australia faced multiple extreme weather events, raising concerns about a potential repeat of the devastating 2019–2020 Black Summer. December saw intense fires in the Grampians National Park in Victoria that have burned tens of thousands of hectares. Forecasts indicate that Australia is likely to experience one of the hottest summers on record.
Weather extremes pose challenges for the solar industry. For PV developers and operators relying on predictable irradiation levels to meet energy targets or financial commitments, deviations like those seen in 2024 can lead to underperformance and financial losses.
Solar developers need high-resolution data and advanced tools to navigate these complexities effectively. High-resolution time series data allows stakeholders to identify trends over years or decades, helping them anticipate future risks related to extreme weather events or pollution spikes. Tracking deviations from expected solar irradiation is essential for understanding performance gaps.
At Solargis, we’ve been working tirelessly to provide these insights through our high-resolution data and analytics platforms. By combining historical data with real-time monitoring tools, we help our partners make informed decisions that reduce risk and maximize returns.
Read also: Solar power performs amid hottest year on record in 2023