Featured products
menu item
Prospect
Quick estimate of PV site's solar potential
menu item
Evaluate
Data, design & PV simulation in one solution
menu item
Monitor
Real-time PV output assessment
menu item
Forecast
Solar power output forecast for up to 14 days
Other solutions
menu item
Analyst
Simplified & unified solar data management
menu item
Integrations
Automate delivery of Solargis data
menu item
Solarmaps
Assess weather impact on PV performance
menu item
PV Components Catalog
Technical specifications of PV components
menu item
Use cases
How we support entire PV plant lifecycle
Solar Resource & Meteo Assessment
Detailed solar resource validation and assessment
Site Adaptation of Solargis Models
Combining satellite data with on-site measurements
Quality Control of Solar & Meteo Measurements
Correction of errors in ground-measured data
Customized GIS Data
Customized Solargis GIS data for your applications
PV Energy Yield Assessment
Estimated energy uncertainties and related data inputs
PV Performance Assessment
Energy estimate for refinancing or asset acquisition
PV Variability & Storage Optimization Study
Understand output variability across wide geo regions
Regional Solar Energy Potential Study
Identification of locations for solar power plants
menu item
Prospect
Quick estimate of PV site's solar potential
menu item
Evaluate
Data, design & PV simulation in one solution
menu item
Monitor
Real-time PV output assessment
menu item
Forecast
Solar power output forecast for up to 14 days
Our expertise
How our technology works
Validation and accuracy
How we validate our datasets and models
Methodology
How we transform science into technology
Knowledge base
Release notes
Success stories
Blog
Ebooks & Whitepapers
Webinars
Publications
Events
Free Maps & GIS Data
Collaterals
About Solargis
Partners
ISO Certification
Careers

New generation Solargis Evaluate: data, PV design & simulation, analysis, and reports in one cloud-based solution. Discover more ->

At Solargis, we’ve just released Solarmaps: a new solution designed to empower PV power plant portfolio managers, operators, and analysts.

Solargis Solarmaps provides timely and accurate insights into the monthly availability of solar resource, air temperature, precipitation (rainfall), and wind speed — key factors that influence PV power plant performance.

In this article, we share what Solarmaps is and how it can support your PV portfolio management.

Diagnosing PV performance in context

Are you considering environmental effects in your PV plant performance evaluation? When performing an initial diagnosis of PV asset performance, the Solargis Solarmaps interactive map offers a complete geographical context of solar and meteorological events. This helps you understand whether your PV system performed in line with actual weather conditions, enhancing transparency and accountability in PV asset management.

Solarmaps allows you to pinpoint specific weather-related events and link them to your PV plant’s performance in the previous month. You can either explore a world map overview or select a precise location (up to three sites) to access localized data.
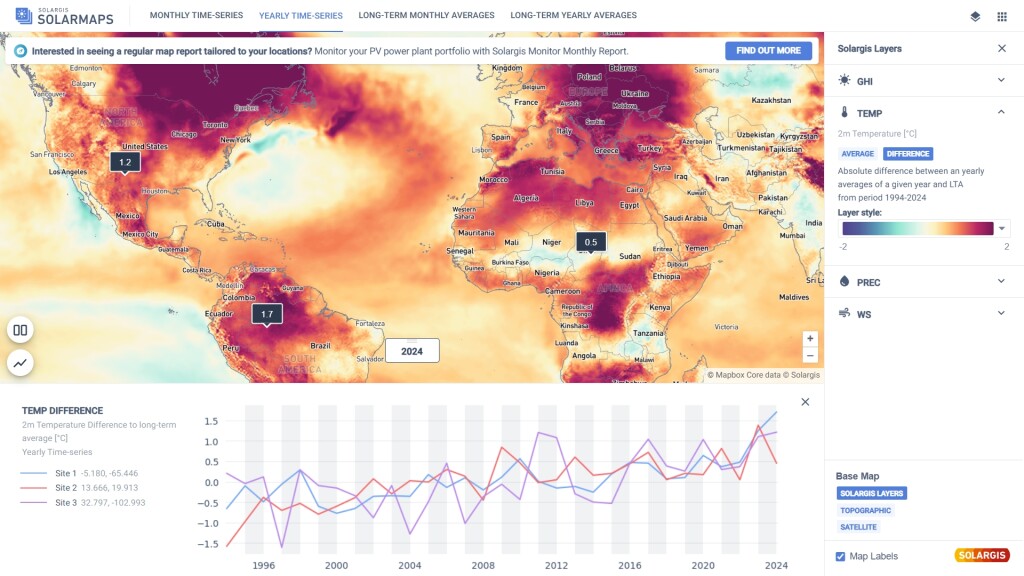
yearly time series solarmaps

What data can you access in Solargis Solarmaps?

In the upper banner of the Solarmaps interface, you’ll find tabs displaying different data aggregations. Depending on the selected tab, the map layer updates to show the corresponding values.

For the latest month and the latest calendar year:

  • Monthly & yearly summary of Global Horizontal Irradiation (GHI)
  • Monthly & yearly GHI difference vs. long-term average
  • Monthly & yearly average air temperature (2 metres)
  • Monthly & yearly air temperature difference vs. long-term average
  • Monthly & yearly precipitation summary
  • Monthly & yearly precipitation difference vs. long-term average
  • Monthly & yearly average wind speed
  • Monthly & yearly wind speed difference vs. long-term average

Long-term monthly and annual averages:

  • GHI
  • Air temperature
  • Precipitation
  • Wind speed

When new data for a recent month becomes available, the existing monthly dataset will be replaced with the most recent month. At any given time, only data for the previous month is accessible.

Key features of Solargis Solarmaps

1. Site-specific data

To view precise, site-specific data for the previous month, simply click on the map to locate your projects. You can select up to three sites at once. Values for the previous month can be compared with long-term averages, helping you attribute deviations in performance to environmental conditions.

The same applies to yearly data. Simply switch the tab in the upper menu from monthly to yearly time-series to access last year’s values.
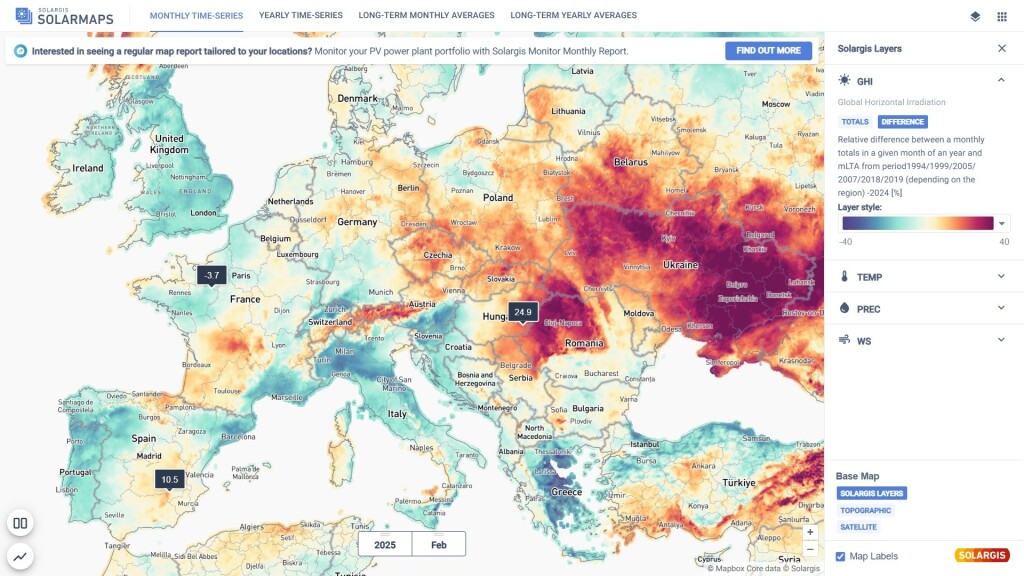
monthly time series solarmaps

2. Custom value range

Once a map layer is selected, you can customize the color scale for the selected parameter for better visualization. This helps highlight areas that are in line with your desired range. To adjust the range, edit the values under the Style section on the right-hand side.
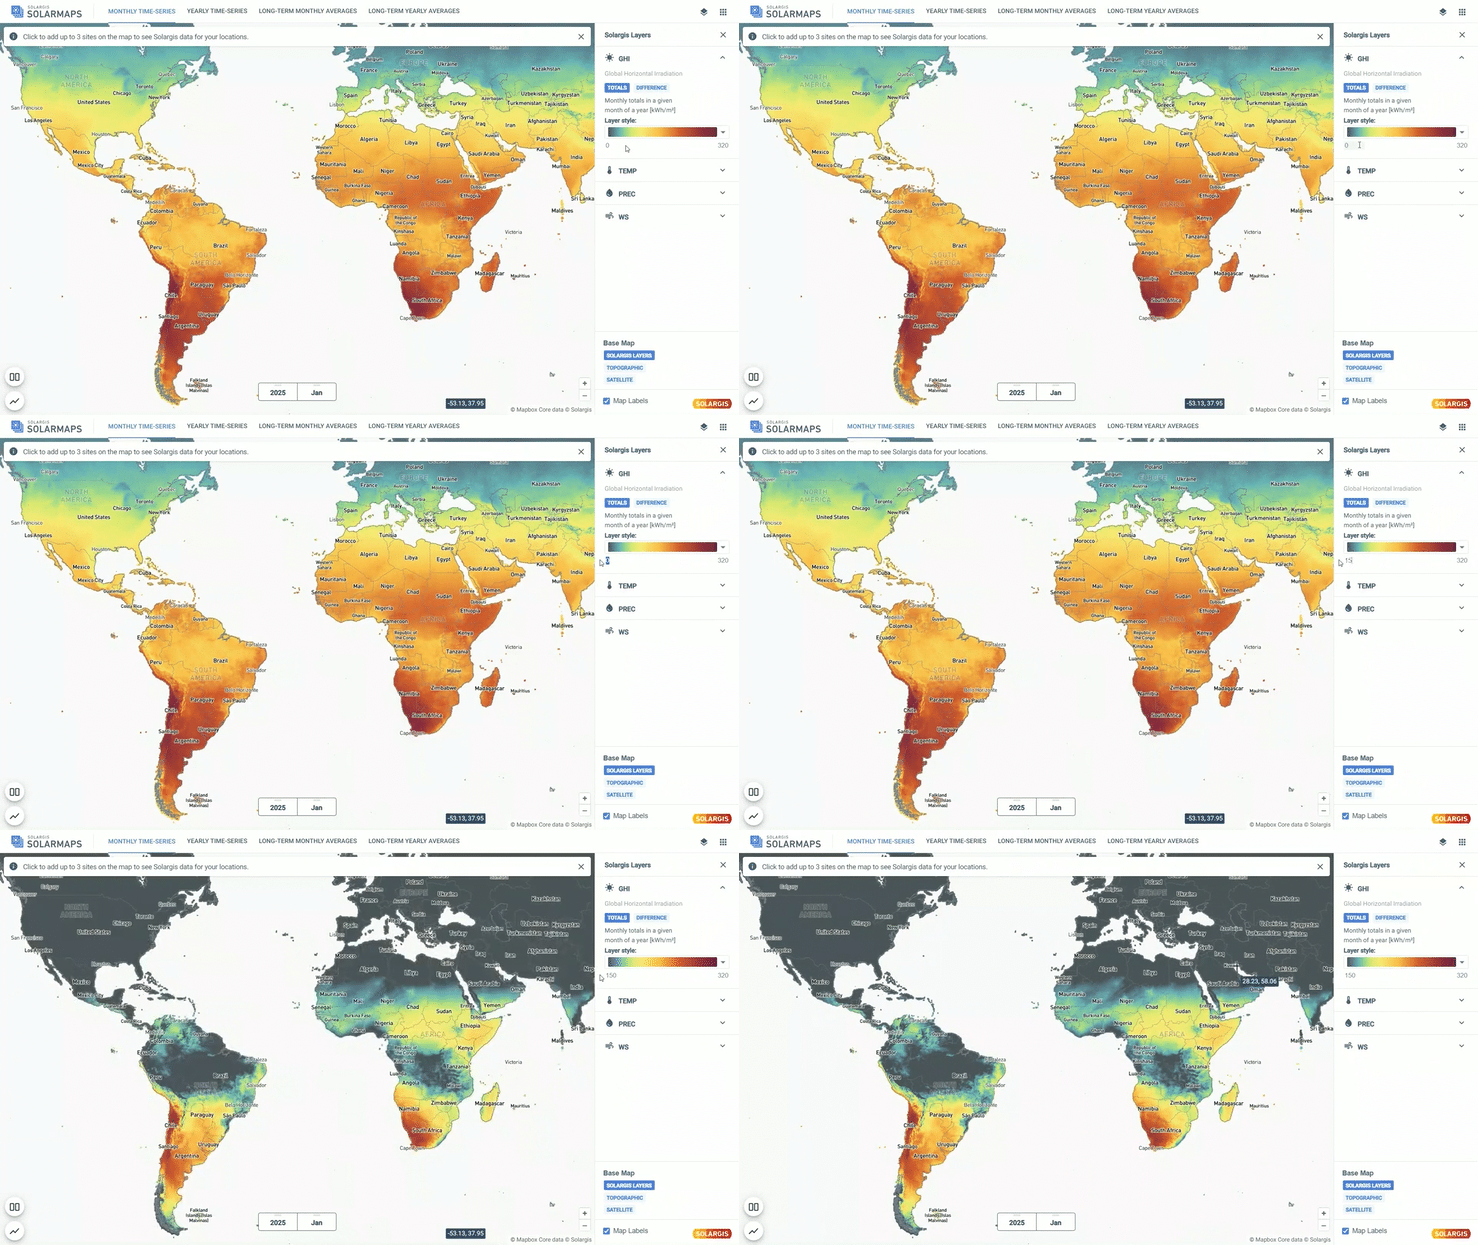
3. Split view

With the split view feature, you can divide the map window into two panels and compare selected variables side by side. This allows you to analyze the correlation between monthly air temperature and GHI in one screen and assess its impact on monthly PV performance.
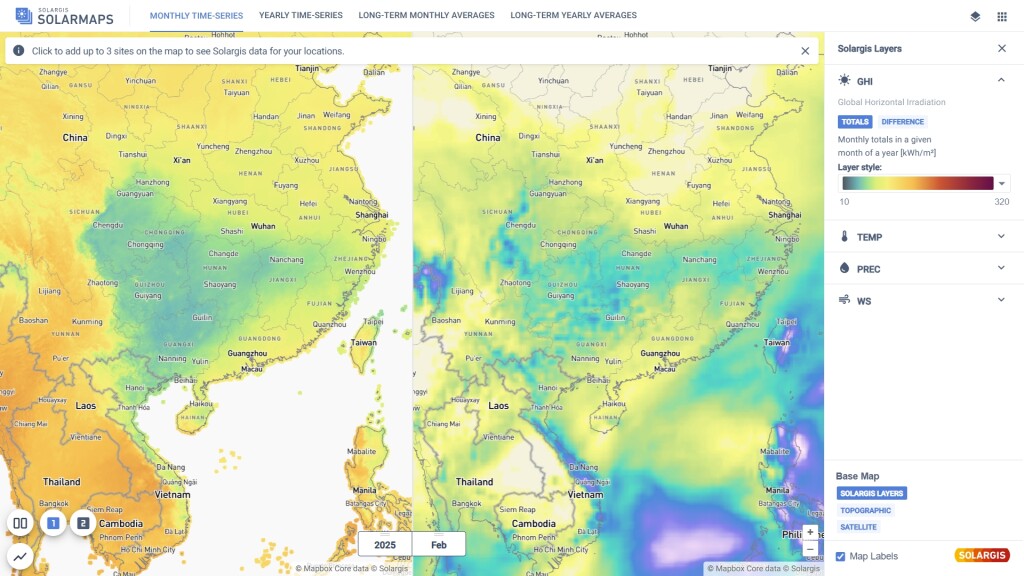
split view solarmaps

4. Graphs

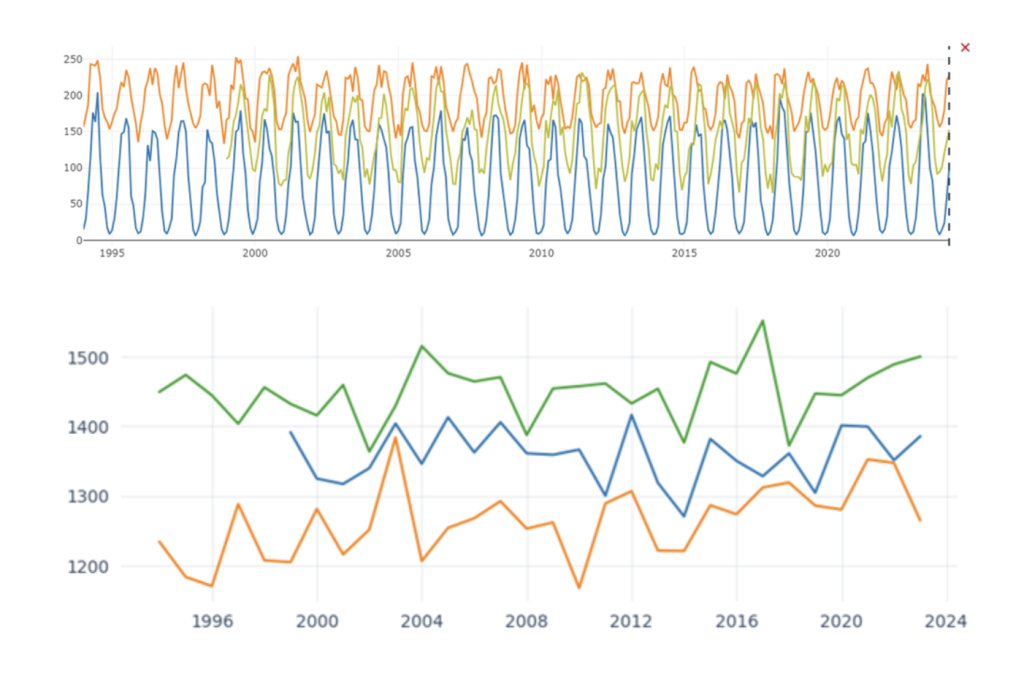
You can select up to three sites and display them in a graph to visualize the full history of monthly or yearly time series data. This makes it easy to spot cyclic changes and seasonal trends. Graphs can be exported in PNG format with a simple right-click for use in reports and presentations.
Solargis solarmaps graphs

How can I access Solargis Solarmaps?

Only Solargis customers can get access to Solargis Solarmaps. The application is automatically available to anyone with an active subscription to any Solargis solution.

Access your account here: https://apps.solargis.com/ 

Keep reading

Precipitable Water (PWAT) - new data parameter
Solargis news

Precipitable Water (PWAT) - new data parameter

Precipitable water or ‘PWAT’ in short, is the depth of water in a column of the atmosphere if all the water in that column were precipitated as rain.

Training in Beijing: sharing our knowledge with chinese professionals and the public
Solargis news

Training in Beijing: sharing our knowledge with chinese professionals and the public

We shared our knowledge with professionals in the solar energy industry in China during Assessment of solar resource measurement technology exchange event.

Annual average values of solar resource and temperature are now available for free via iMaps
Solargis news

Annual average values of solar resource and temperature are now available for free via iMaps

From today onwards, we are also opening access to long-term annual averages of key solar parameters GHI, DIF, and DNI via Solargis iMaps prospecting tool.