Táto stránka zatiaľ nie je preložená do slovenčiny. Pozrieť si ju môžete v angličtine.
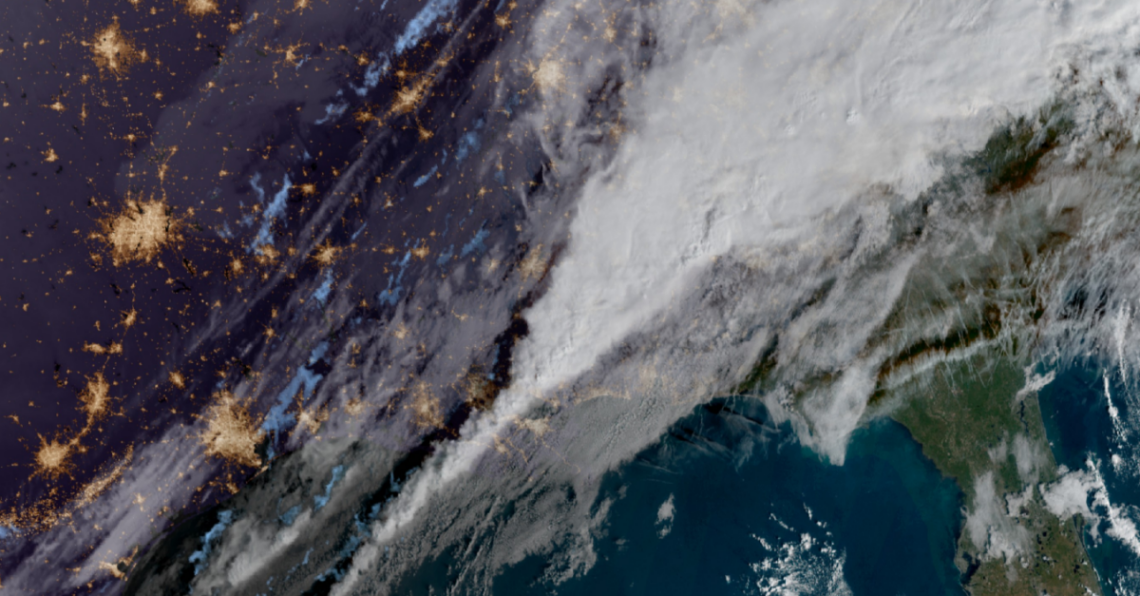
Great news for our North American clients. From now on, the Solargis Forecast platform provides early warnings for one of the most damaging weather hazards for solar power plants: Hail forecasting - crucial especially in regions with frequent severe storms. As the continental United States is one of the areas most affected by hail, we’ve launched this update for this region first, with plans to expand coverage in the near future.
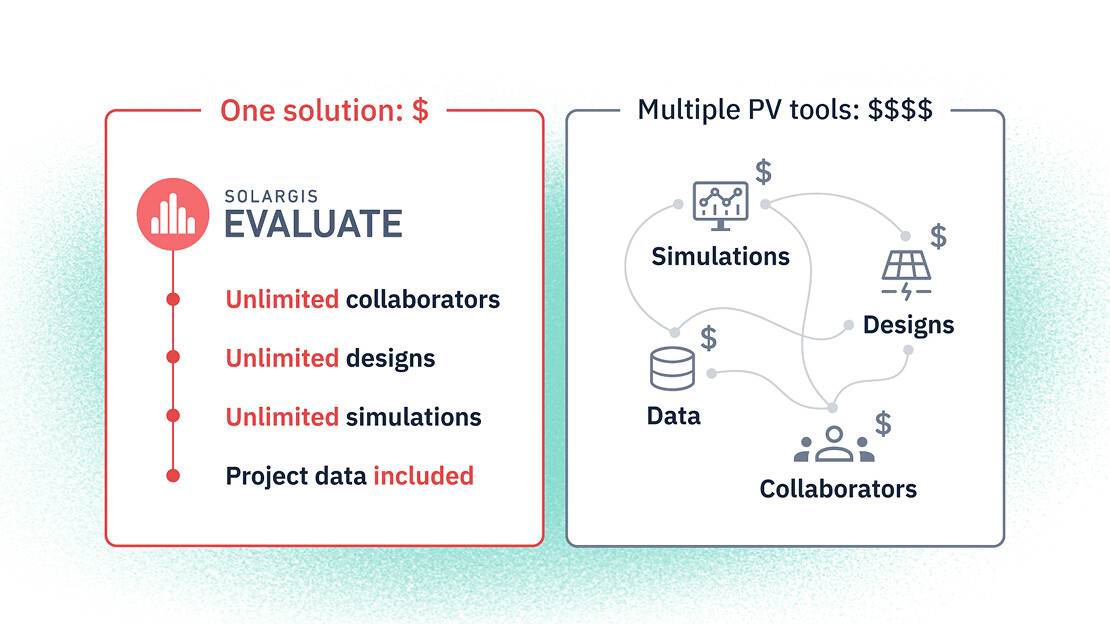
Twelve months have passed since we launched the new Solargis Evaluate platform. We are proud to say that since then, we have made numerous great product updates and Evaluate has grown to be an even more powerful solution for complete PV project design and evaluation. Learn about the most important updates and new features.
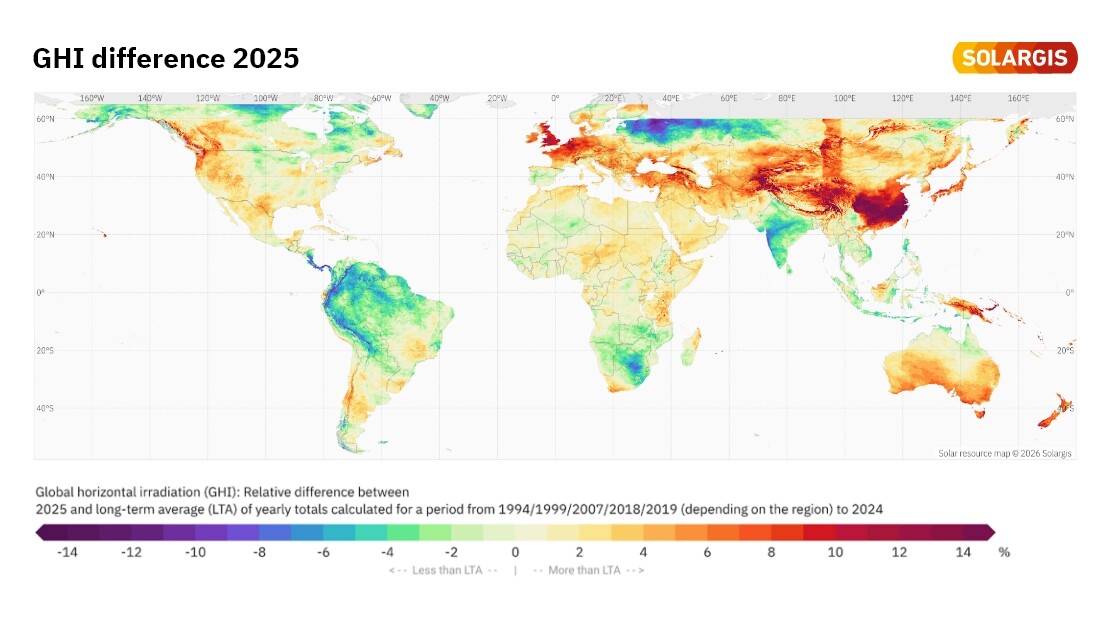
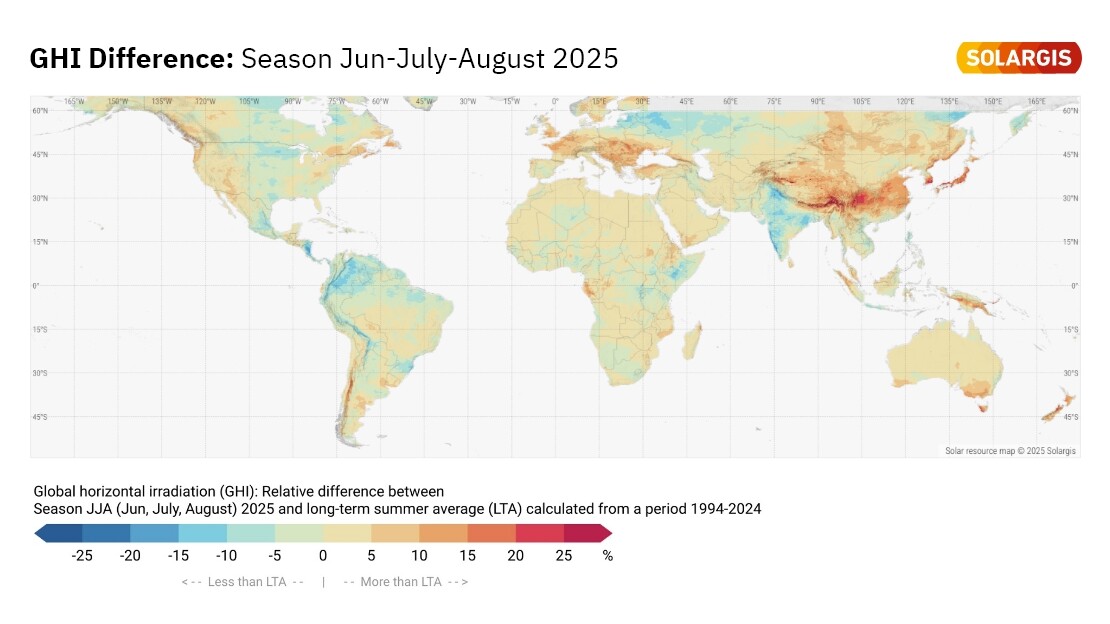
As every year, we bring you a map summarizing last year’s global horizontal irradiation (GHI) anomalies, highlighting how much regional weather conditions diverged from long-term averages (LTA). These maps help project developers, asset managers, and investors understand how atmospheric variability may have influenced PV performance worldwide.
It’s been a year since we launched Solargis Evaluate 2.0, the platform that brings high-quality solar and meteorological data, system design, and advanced PV simulation together into one solution. Today, we’d like to share some good news. From now on, every active project in Solargis Evaluate includes unlimited TMY P50 PV simulations in 15-minute temporal resolution.
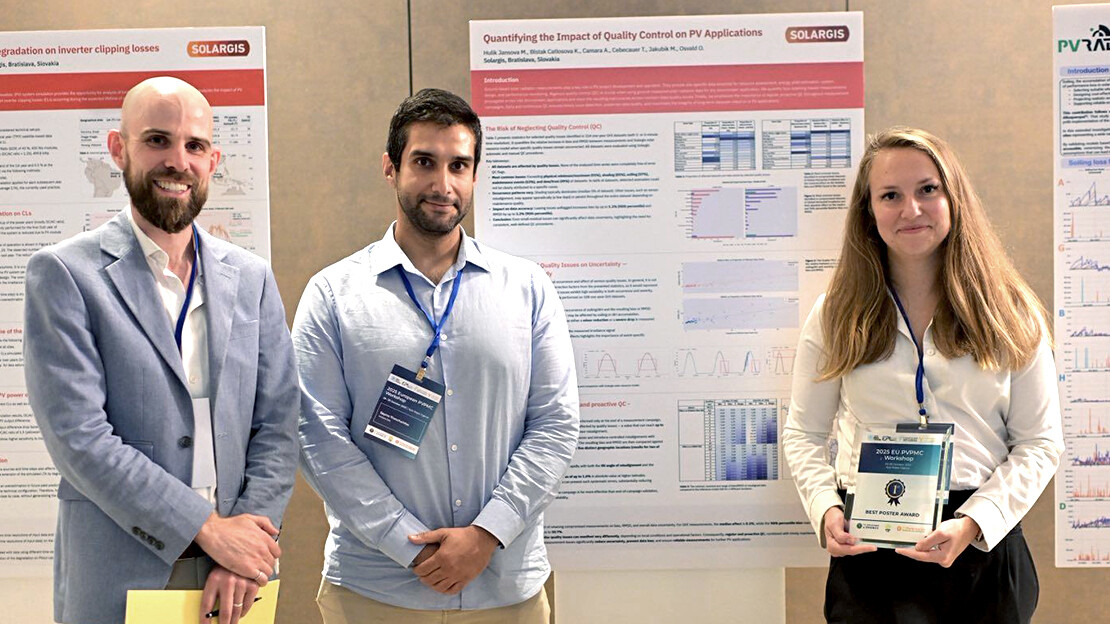
The Solargis team recently joined the Photovoltaic Performance Modeling Collaborative (PVPMC) 2025 Workshop, held on 29–30 October in Ayia Napa, Cyprus. This year’s event brought together leading experts in PV performance modeling, system analytics, and solar energy integration, with a special focus on the challenges and solutions of island grids.
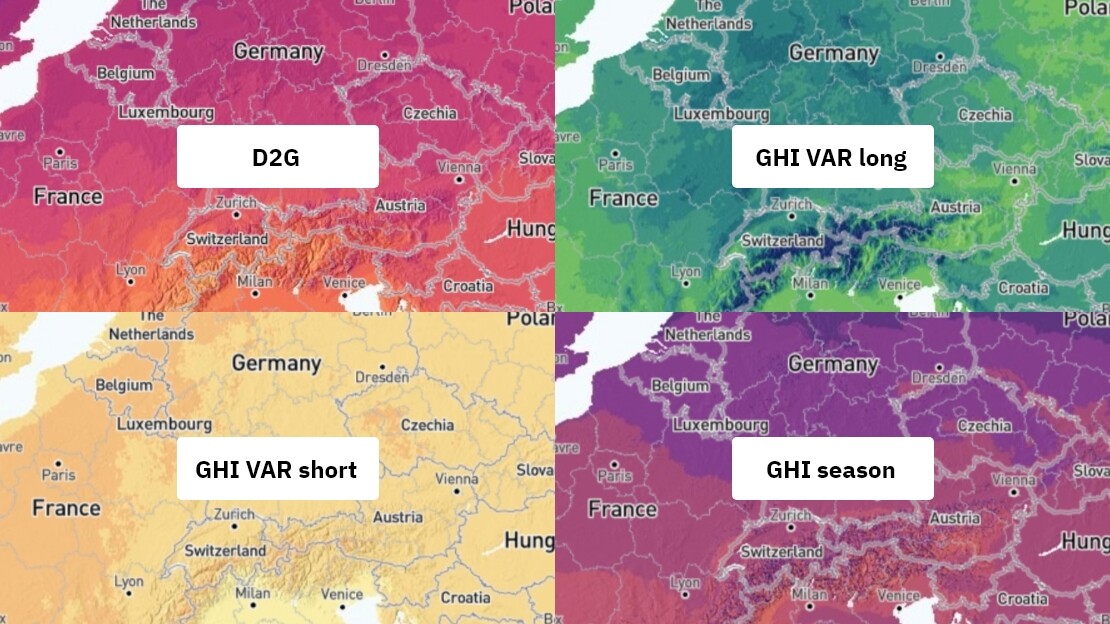
When prospecting and evaluating solar projects, most attention goes to Global Horizontal Irradiation (GHI). It is the most widely used metric for solar resource assessment and the basis of nearly every PV feasibility study. But GHI is only one of the many parts of the picture. At Solargis, we go deeper.
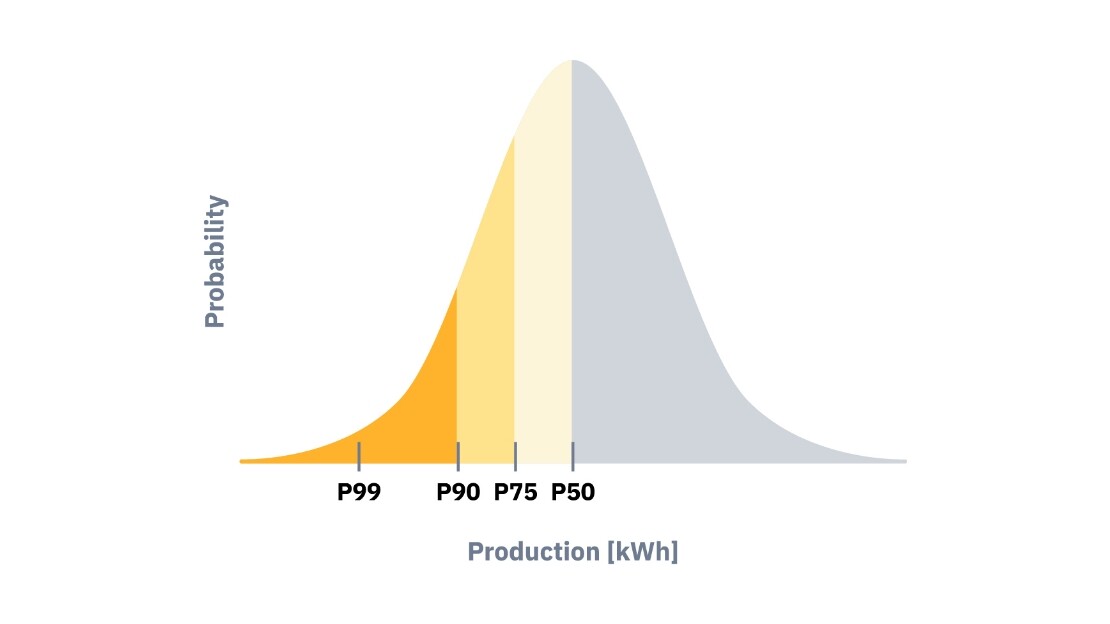
One of the most critical outputs from PV simulations is the P50 annual energy yield estimate. Often referred to as the "best estimate," the P50 value represents the annual energy yield that has a 50% probability of being exceeded (with an equal 50% chance that the actual yield will fall below it).
However, relying solely on the P50 value may be too optimistic for project stakeholders. To address this, additional probability-based yield estimates are commonly used e.g. P90 value, which indicates the energy yield expected to be exceeded 90% of the time.
During June, July, and August 2025 — corresponding to summer in the Northern Hemisphere and winter in the Southern Hemisphere — global solar irradiation largely stayed close to long-term averages, with most regions falling within ±8% of typical values. However, several areas diverged significantly from this range.
In the solar industry today, we face a fundamental challenge: distinguishing between data that are based on physics and validated scientific methodology, and those that are a product of subjective manipulation and legacy approaches. This distinction has a profound impact on the quality of decision-making and the long-term success of projects.
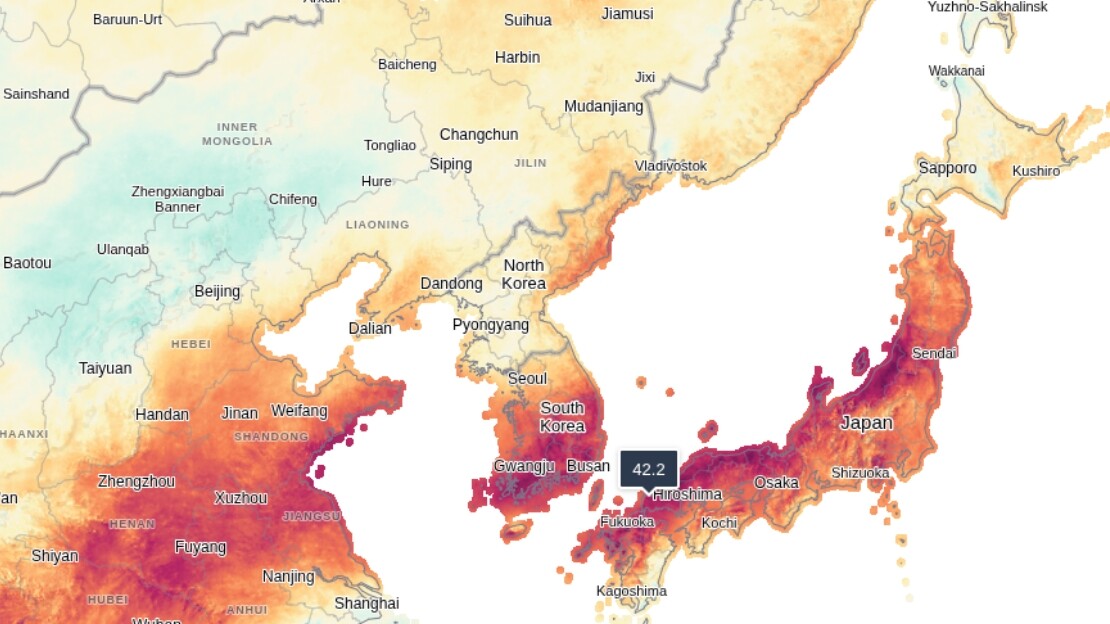
Based on our proprietary Solargis data, we are able to track and analyse unusual patterns in solar resource availability. At Solargis, we run these analyses every month, with global coverage. In Japan, South Korea, and eastern China, we observe some of the strongest positive anomalies (regionally over +40%), while Taiwan and the northern Philippines experienced notable deficits (below -35%).
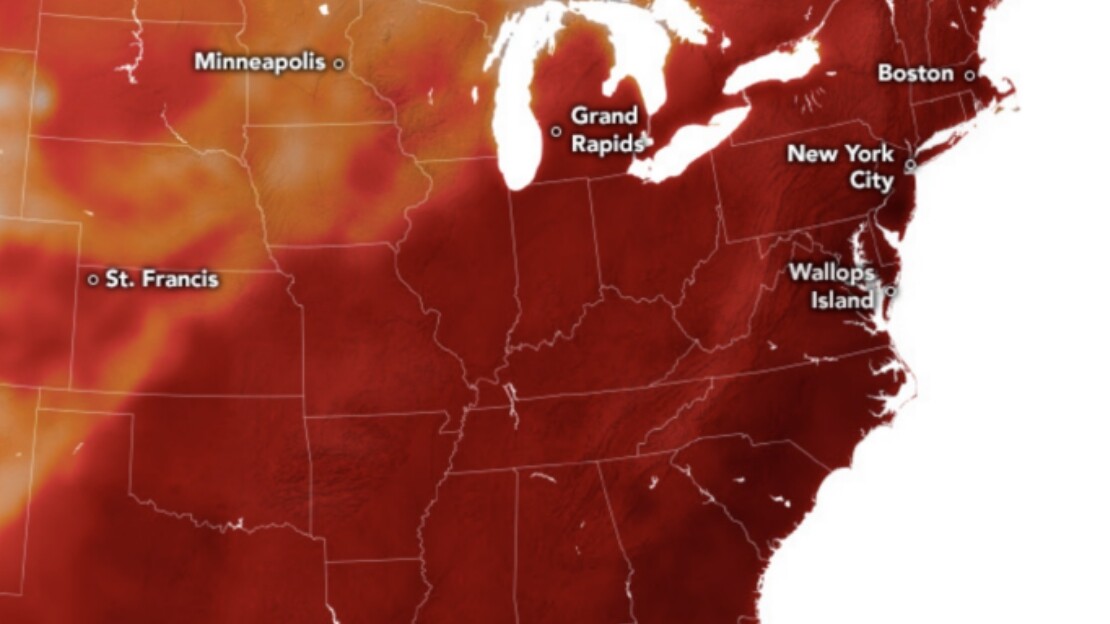
The recent heat dome that enveloped large parts of the Midwest, Northeast and Southeast of the U.S., including states like North Carolina and Maine, has exposed vulnerabilities in the operational and trading strategies of utility-scale solar projects. These extreme weather conditions had direct operational consequences.
In the context of PV yield simulation, uncertainty helps users understand the potential deviations in the results produced by the software they are using. Understanding these deviations plays a key role in selecting the optimal design of a power plant and in evaluating financial risks and return on investment.
Western Europe has experienced one of its sunniest springs on record, with solar irradiation levels significantly exceeding historical long-term averages. Our proprietary solar irradiance data reveals that some areas recorded up to 50% more Global Horizontal Irradiation (GHI) compared to long-term (30 year) averages.