Táto stránka zatiaľ nie je preložená do slovenčiny. Pozrieť si ju môžete v angličtine.
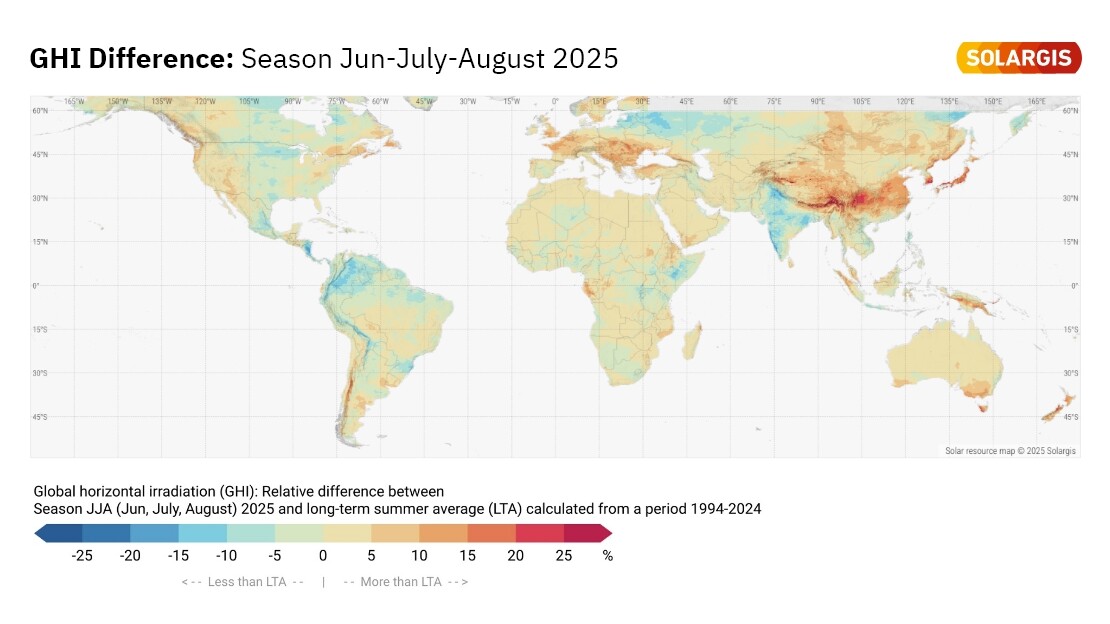
Western Europe has experienced one of its sunniest springs on record, with solar irradiation levels significantly exceeding historical long-term averages. Our proprietary solar irradiance data reveals that some areas recorded up to 50% more Global Horizontal Irradiation (GHI) compared to long-term (30 year) averages, creating favourable conditions for solar energy generation.
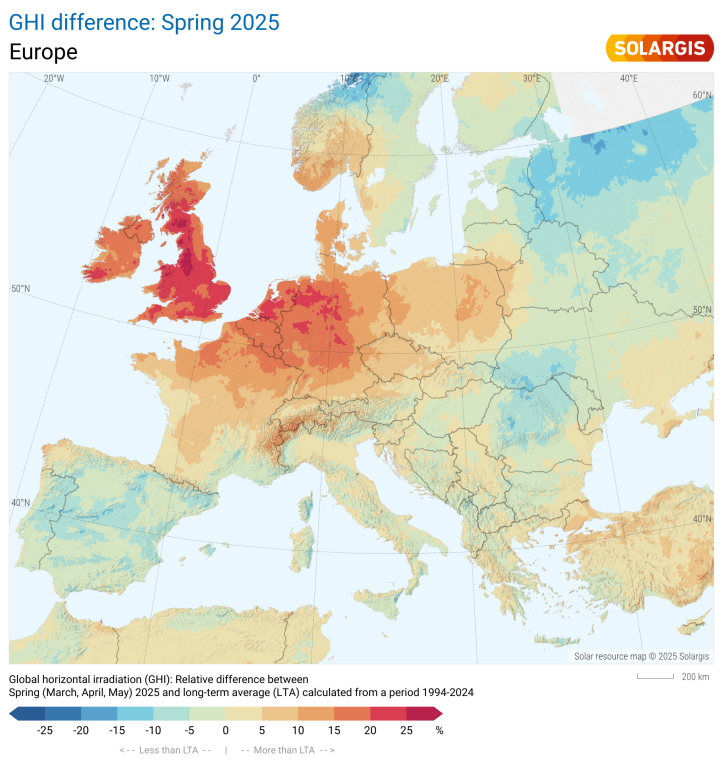
Map of GHI difference Spring 2025 vs LTA Spring 2025 (months March-April-May)
Over the months of March, April and May, Western Europe – including the UK, Belgium, the Netherlands, Luxembourg, North-West France, and Western Germany – experienced significantly above-average GHI:
Parts of Belgium, Germany, and the UK saw GHI levels up to 50% above long-term averages.
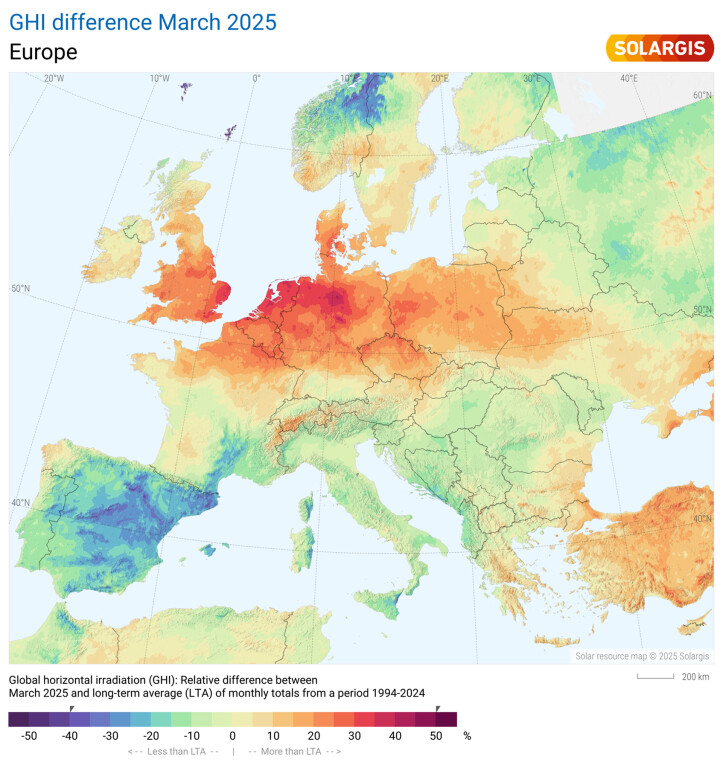
Map of GHI difference March 2025 vs LTA March 2025
Most of North-Western Europe recorded levels 35% above average, except for southern European countries – Spain, Portugal, and Italy – which experienced up to 25% below the long-term average.
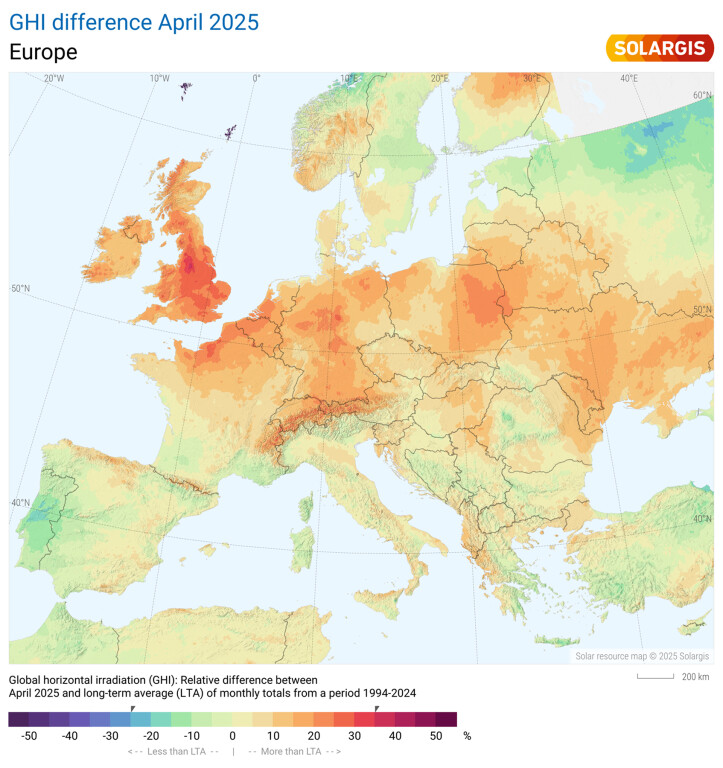
Map of GHI difference April 2025 vs LTA April 2025
Scotland saw GHI levels up to 35% above average, continuing the above-average trend across the region.
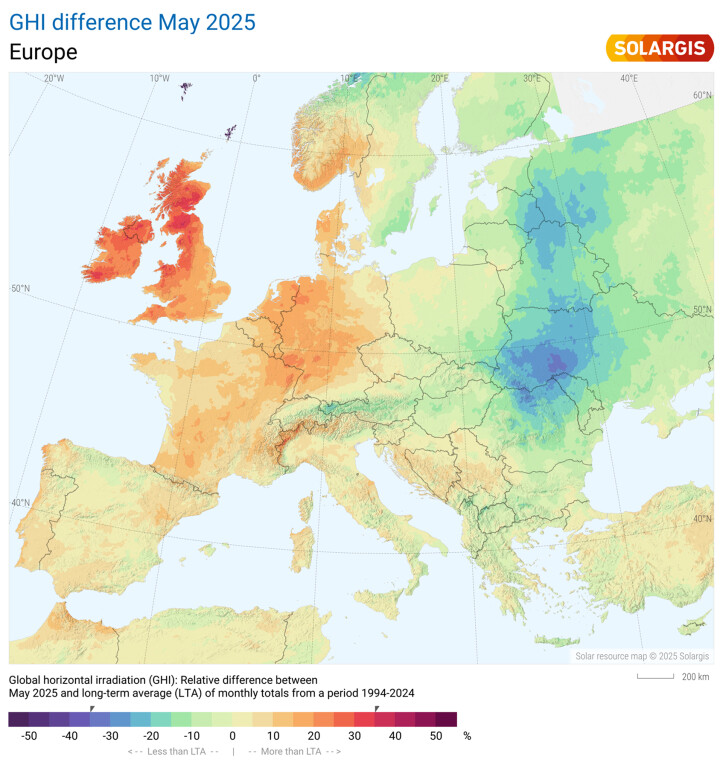
Map of GHI difference May 2025 vs LTA May 2025
According to recent reporting by euronews, the surge in solar irradiance has already had a measurable impact on power generation trends, particularly in the UK. The country saw solar output rise by 42% year-on-year, generating 7.6 terawatt hours (TWh) of electricity in the first five months of 2025 – a record-breaking milestone.
For the first time, solar accounted for more than 10% of the UK’s monthly electricity generation in both April and May, reducing reliance on imported gas and contributing to an estimated €710 (£600) million in fuel cost savings.
While increased solar resource availability has created opportunities for higher-than-expected energy yields, it also underscores the growing need for precise forecasting and project evaluation solutions. The variability in solar irradiance across Europe means that some regions saw below-average irradiation, like Spain, Portugal and Italy, reinforcing the importance of data-driven decision-making in Europe’s solar sector.
To navigate these fluctuations effectively, high-resolution time series data is becoming essential for PV developers and operators. Compared to hourly TMY datasets, time series offer a more accurate representation of both short-term variability and long-term trends, enabling better resource planning and operational stability. As solar stakeholders increasingly prioritize precision, adopting time series as the industry standard will support more resilient and optimized energy generation.
March 2025 saw up to 200mm above the long-term 30-year average in Spain and Norway, while the UK and parts of Germany experienced up to 140mm below average. May was notably dry across most of North-Western Europe, with up to 80mm below average across the UK, France, and Germany.
These precipitation trends broadly mirrored solar irradiance levels, as areas with lower-than-average rainfall generally experienced higher-than-average solar exposure, reinforcing the need for careful monitoring and strategic adaptation to ensure long-term stability and effective energy yield.
Precipitation maps for March, April, May.
Despite these challenges, Europe is well-positioned to capitalize on favourable solar irradiance conditions. With solar power generation increasing across multiple markets, the sector continues to play a growing role in reducing fossil fuel dependence and enhancing European energy security.
Subscribe to Solargis monthly maps to receive monthly solar maps with insights into solar trends and their impact on energy markets.