Táto stránka zatiaľ nie je preložená do slovenčiny. Pozrieť si ju môžete v angličtine.
Every January, Solargis brings you maps summarizing last year’s global horizontal irradiation (GHI) anomalies. This year is no exception.
These maps highlight how much regional weather conditions diverged from long-term averages (LTA), helping project developers, asset managers, and investors understand how atmospheric variability may have influenced PV performance worldwide.
The 2025 GHI difference maps show that global solar irradiation reached both positive and negative extremes last year, with the highest positive anomalies reaching up to 20% above long-term averages.
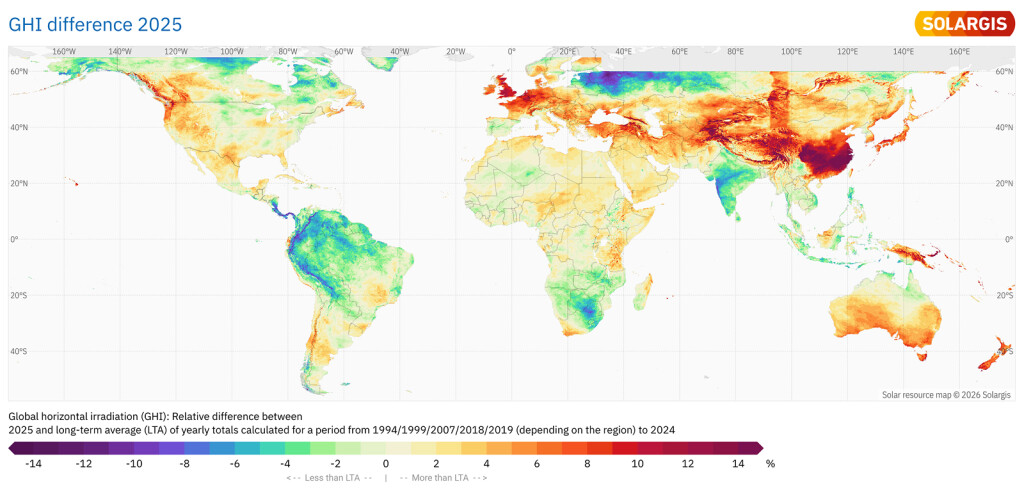
Note: This year, we extended our standard color-scale legend to a -14% to +14% range (previously -12% to +12%) due to an extreme anomaly in Central China.
Below, we dive into selected regions in more detail.
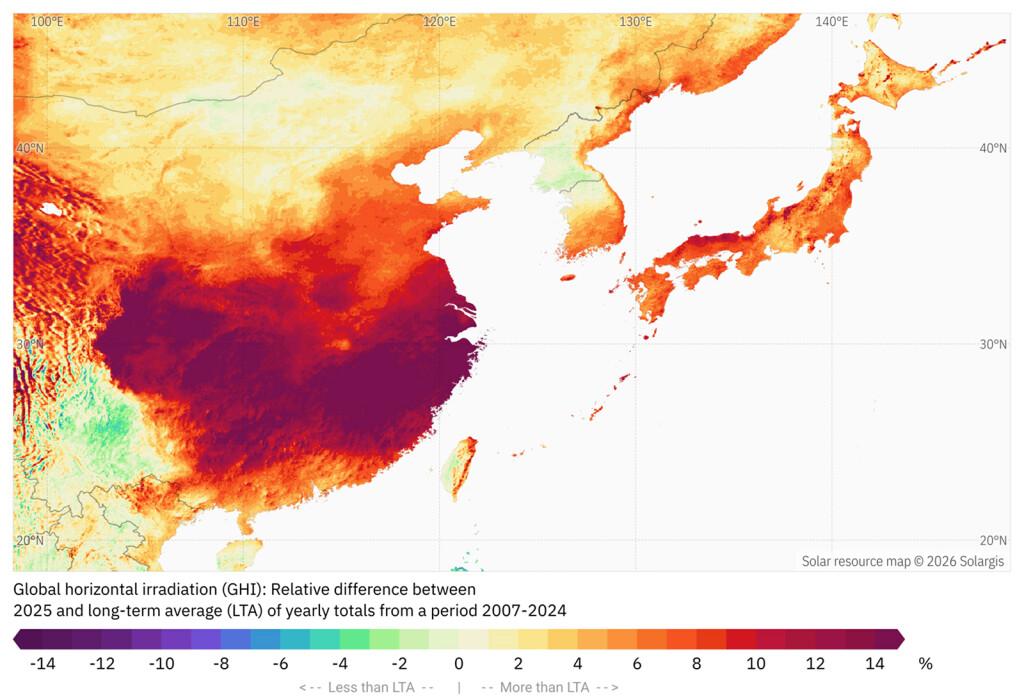
The standout story of 2025 is East Asia, particularly Central East China and parts of the Sichuan Basin. Central East China recorded +15% above the long-term norm, with parts of the Sichuan Basin reaching +20%. This continues a multi-year trend: the last four to five years have all been above average, making 2025 another exceptional chapter for PV operators in these provinces.
Neighbouring countries also experienced a strong year. Japan and the eastern coastal regions of South Korea saw widespread anomalies of +4% to +10%, supporting above-expected PV output at many sites.
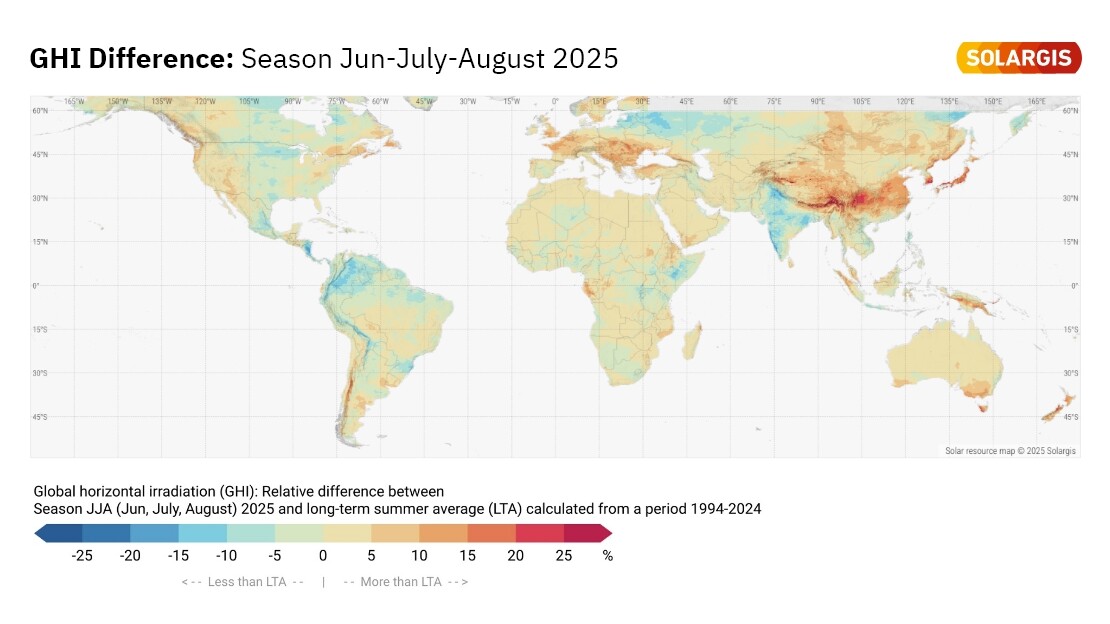
These solar irradiation anomalies were already evident during summer 2025, when Japan experienced a record-breaking heat wave.
Overall, the available solar resource in this region was 13% to 22% above the long-term summer average, with some local areas exceeding 25%. Beyond solar resource conditions, air temperatures were also exceptionally high. For the third consecutive year, the country set a new record for average July temperatures, with July 2025 finishing 2.89°C above the 1991–2020 climatological average.
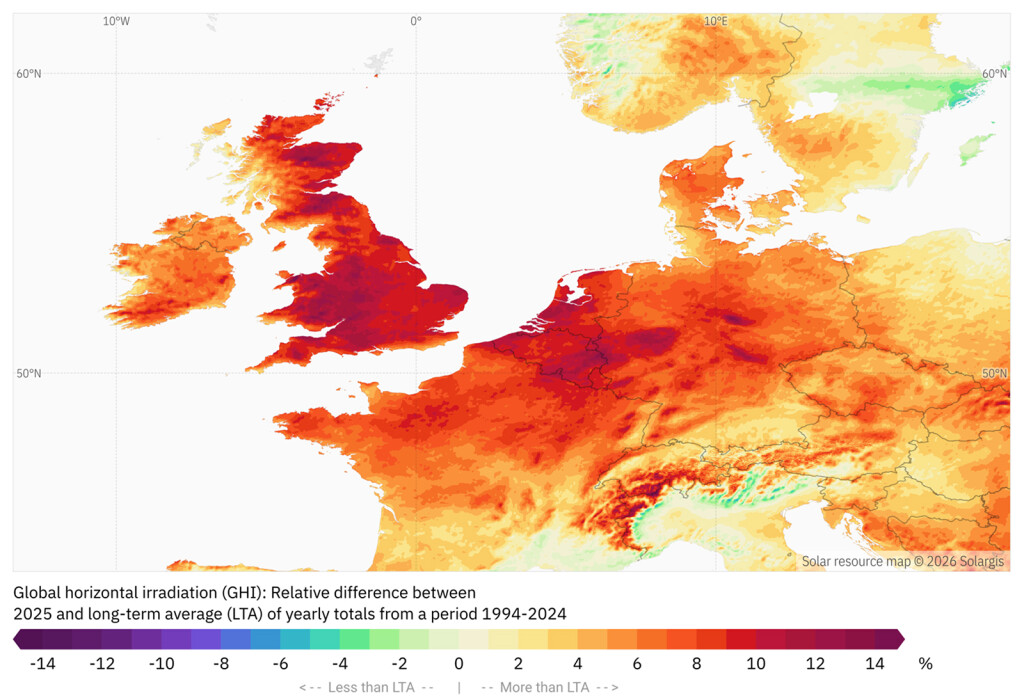
In Europe, 2025 brought positive (higher-than-average) anomalies, although levels varied across the continent. Notably, the UK had its sunniest year on record, and Solargis data show that numerous regions in the UK and Benelux recorded irradiance exceeding +10% compared to LTA. Much of Western, Central, and Southeastern Europe came in at +4% to +10% above the norm.
For project operators dealing with tight margins and volatile markets, 2025 offered a welcome boost to yield across Europe.
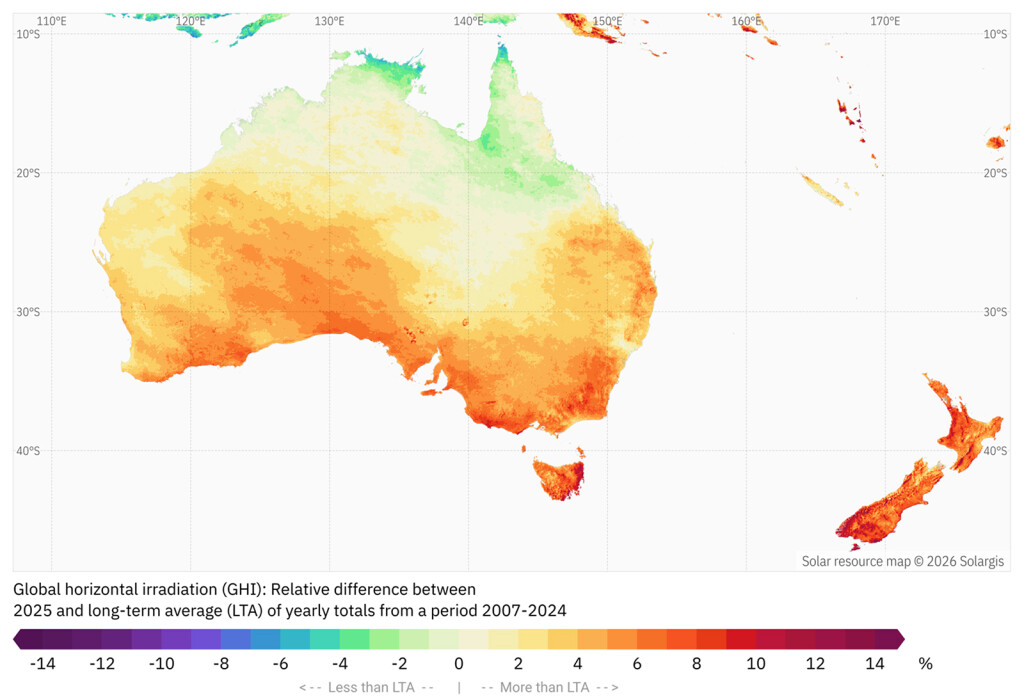
Another positive hotspot emerged in Southeast Australia and New Zealand, where values typically ranged from +3% to +10%. Developers in this region reported anecdotally strong production months, consistent with the patterns we see in the 2025 map.
A more localized but remarkable positive spike appeared over New Britain and New Ireland islands (Papua New Guinea), where irradiance anomalies often exceeded +15% above LTA.
Not all parts of the world shared in the unusually bright year.
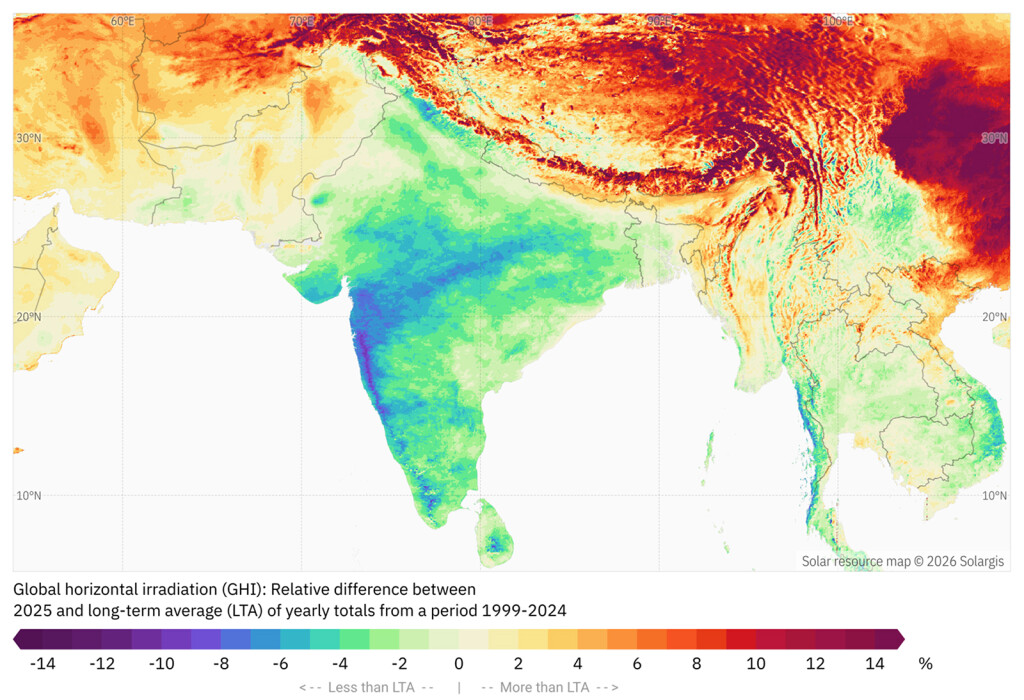
Most of India again recorded a below-normal year, ranging from -1% to -8%, with the strongest anomalies along the southwest coast (down to -10%). One factor affecting the available solar resource was an unusually long and intense monsoon season.
Compared to previous decades, the monsoon has shown noticeable shifts in its behavior, as analyzed by multiple sources (e.g., this media article). These conditions highlight the importance of accounting for monsoon variability in solar energy planning and forecasting.
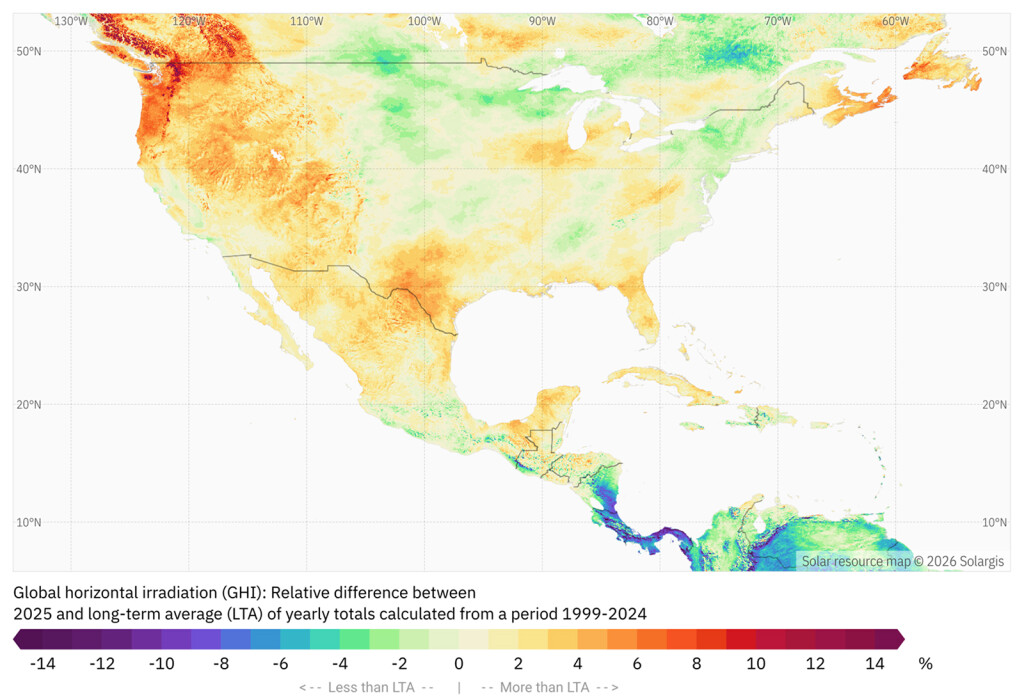
While the United States, Canada, and Mexico saw stable solar performance overall, Central America experienced a significant dip in solar irradiance – most notably in Panama, Costa Rica, and Nicaragua. This was largely driven by a stronger-than-average hurricane season in the second half of the year, with heavy rainfall reducing the available solar resource. Solargis data show GHI levels -7% to -12% below average.
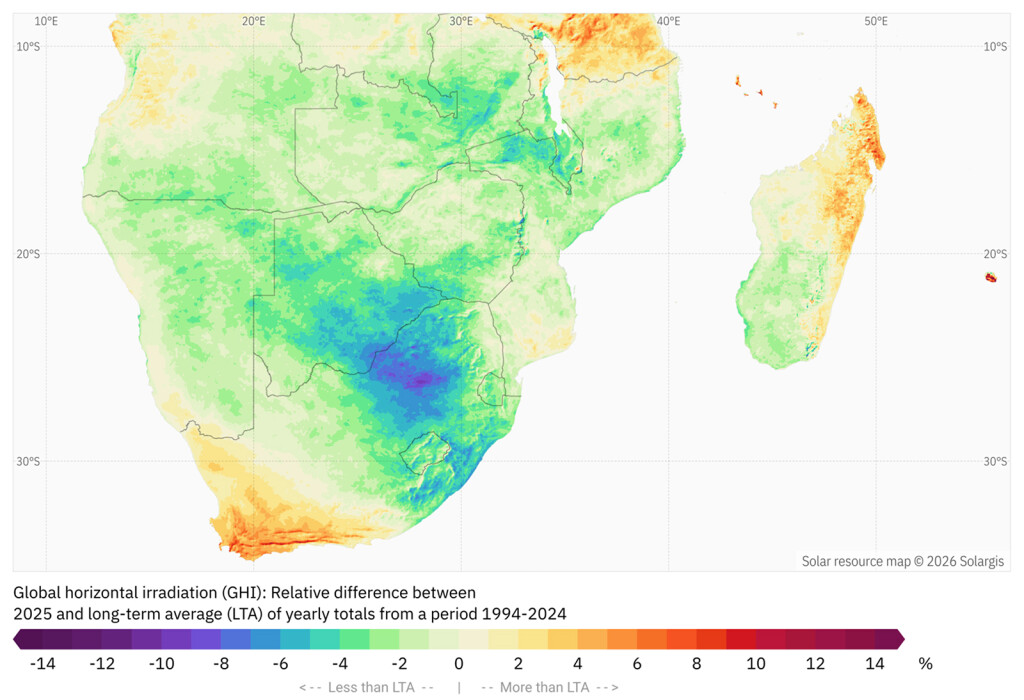
Other noteworthy patterns were observed in the Johannesburg–Pretoria region (South Africa), where anomalies reached -8%.
Local drops in the -5% to -8% range also appeared in Southeast Asia, including central Vietnam, northwest Malaysia, central Java, and surrounding islands. Another notably dark region in 2025 was the area between Moscow and St. Petersburg, where anomalies exceeded -12%.