Finding suitable land for utility-scale solar is rarely a simple question of identifying where the solar resource is strongest. Land use, agriculture, protected areas, terrain, infrastructure, and other constraints can significantly reduce the areas where projects can realistically be considered.
This is why early-stage PV planning requires more than solar resource maps. It requires a structured geospatial methodology that can combine technical, environmental, and social factors into a clear view of where solar development is feasible.
This challenge was explored as part of the Solar Mapping and Development Plan, an international project supporting solar development in Indonesia’s JAMALI – Java, Madura, and Bali – region (see more about the project at the end).
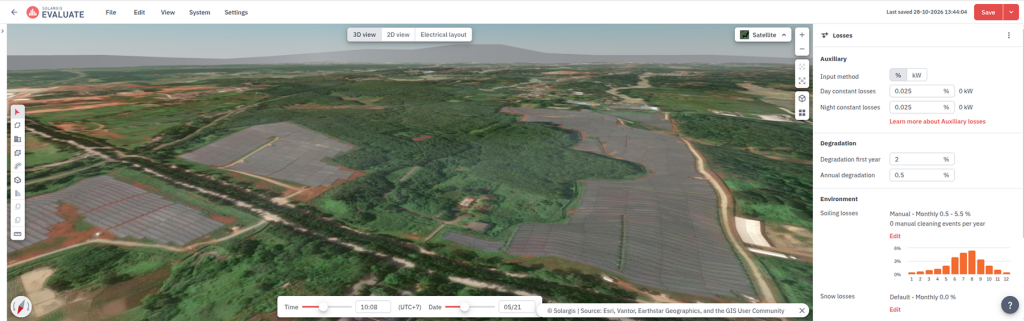
Image 1: In recent years, one of the most significant utility-scale PV development in the JAMALI region has taken place around Purwakarta, West Java. The screenshot from Solargis Evaluate shows an 11 MWp section of a larger solar PV cluster, launched in 2025.
As part of the project, Solargis contributed the geospatial analysis, which formed the first stage of a broader assessment that also included environmental and social, grid integration, financial, and regulatory analyses.
The geospatial analysis ultimately identified approximately 700 GWp of theoretical potential and provided the basis for selecting 151 high-scoring qualified sites for further study at prefeasibility level.
At EU PVSEC 2026, we presented the methodology and findings of our geospatial work. The results demonstrate why high solar potential alone tells us relatively little about where utility-scale PV can actually be located.
Indonesia has ambitious objectives for solar PV development. Around 184 GW of wind and solar capacity is needed by 2060, while the reality is that installed solar PV capacity was only around 1 GW by 2024. The JAMALI grid is particularly important as Indonesia’s largest electricity system and home to much of the country’s electricity demand.
The starting question for the geospatial analysis was straightforward: Is there enough space for tens to hundreds of gigawatts of utility-scale PV in JAMALI, an environmentally complex and densely populated area?
The answer turned out to be yes.
Our analysis identified approximately 12,519 km² of qualified land (around 9% of the region’s total land area). In theory, this area could accommodate approximately 700 GWp of utility-scale PV capacity. In practice, only a fraction of this potential needs to be developed, allowing the next stages of the analysis to prioritize the most suitable locations for solar projects.
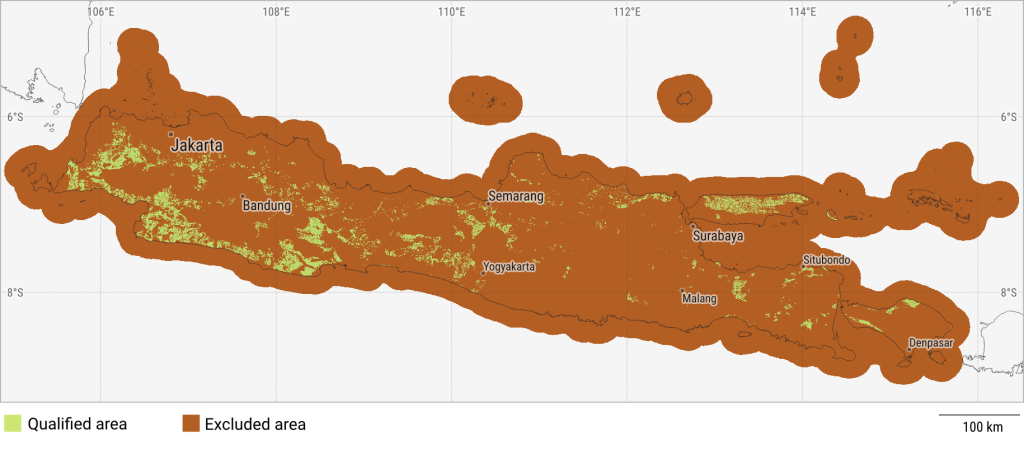
Figure 1: Map of JAMALI showing land qualified for potential utility-scale PV development.
The analysis combined global open datasets, local authority data, and proprietary Solargis datasets.
Each source brought different strengths. Global datasets make country-scale analysis possible even where local data is limited. Local datasets provide more detailed information on land use and locally relevant restrictions. Solargis data adds high-quality solar and terrain information, including short-term solar resource variability, a specialized Solargis layer for which no comparable public dataset is available.
Because these datasets came from different sources and at different resolutions, they were harmonized into a common spatial framework before the analysis.
The methodology used two complementary steps:
1/ Qualification
Qualification determined whether an area could be considered for utility-scale PV at all. Each location had to pass all qualification criteria; failing a single exclusion criterion removed it from the qualified area.
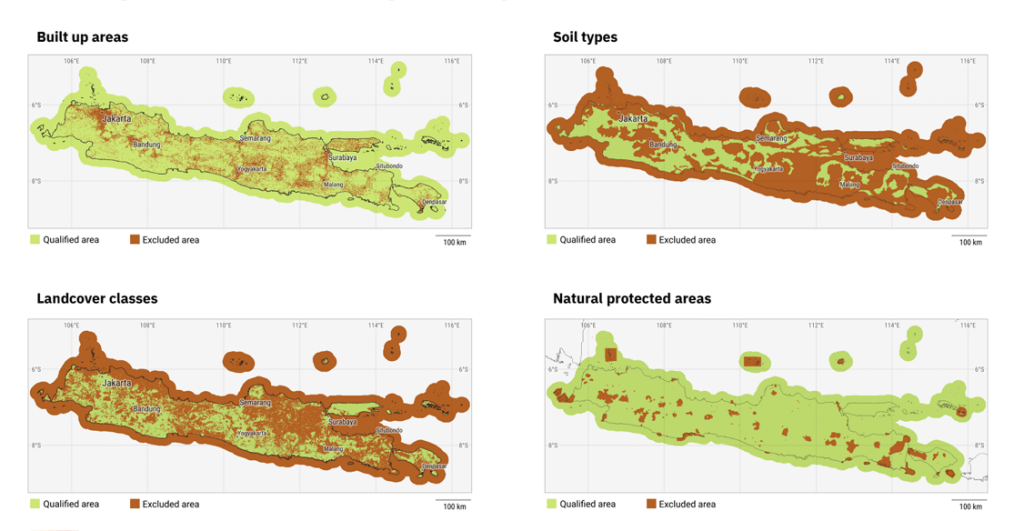
Figure 2: Examples of map layers used during area qualification assessment.
Among the individual qualification criteria, land cover and soil type were the most restrictive. Only 39% of the analyzed area passed the land-cover criterion, while 43% passed the soil criterion. By comparison, much larger shares passed criteria related to slope, protected areas, volcanic activity, indigenous territories, and cultural heritage.
The soil criterion is particularly important in the Indonesian context. Rather than excluding agricultural land altogether, the methodology was designed to retain lower-productivity soils where PV development could potentially be considered while protecting more productive agricultural land.
2/ Scoring
Scoring assessed the relative suitability of locations based on factors such as solar power potential, short-term variability, terrain, road accessibility, and seismic and volcanic activity. These factors were combined into a composite score reflecting productivity, risks, and costs.
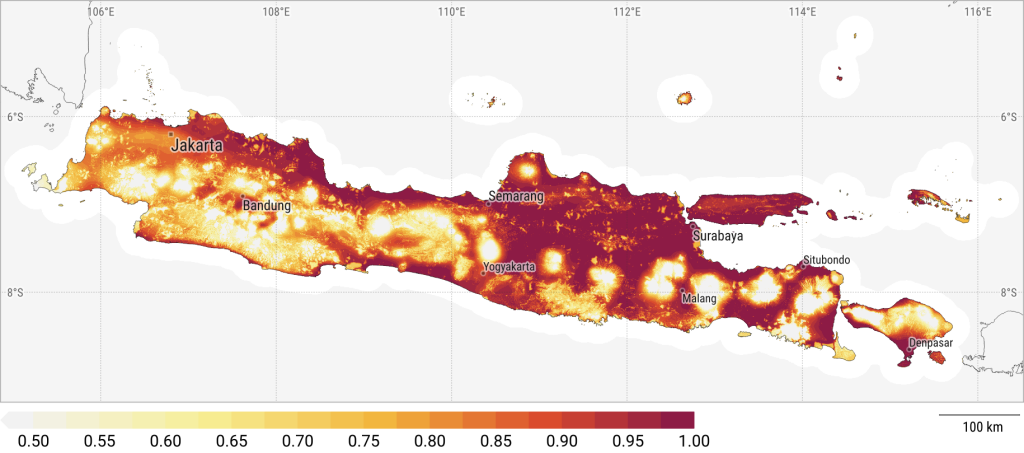
Figure 3: Final scoring composite showing the relative suitability of areas based on solar potential, development practicality, and risk-related criteria.
The scoring and qualification maps were then combined to identify qualified areas with the strongest overall scores.
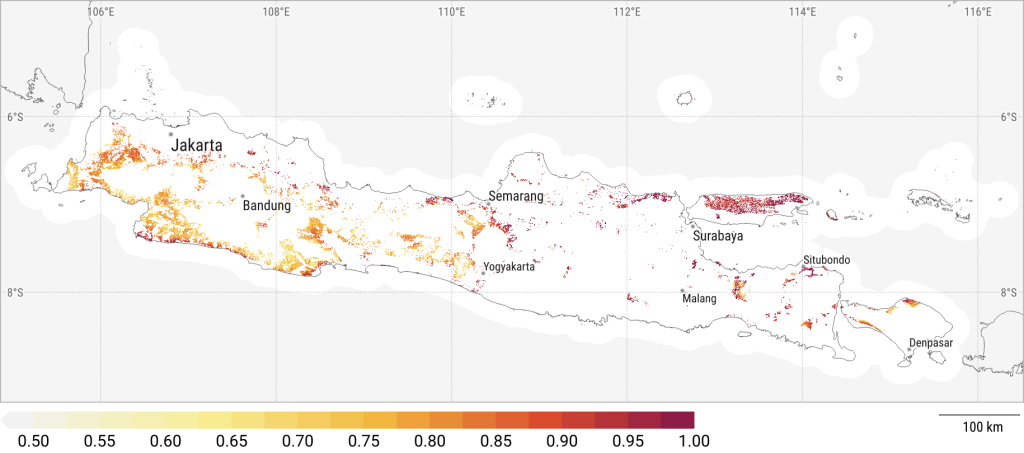
Figure 4: Final suitability map combining qualified areas with composite score.
The analysis showed a significant difference between areas that scored highly and those that were actually qualified for potential PV development. Some of the highest-scoring areas, particularly along Java’s northern coast, overlapped with densely built-up areas or productive agricultural land and were therefore excluded during qualification.
Favorable solar and technical conditions do not necessarily mean that a location is suitable for PV development. Land availability and existing land use can significantly constrain the developable area, making it smaller and more fragmented.
The geospatial analysis identified theoretical spatial potential and provided the basis for the subsequent stages of the Solar Mapping and Development Plan project. It did not determine which projects were ultimately bankable or development-ready.
Using the geospatial results, 151 sites in high-scoring qualified areas were selected for further study at prefeasibility level. The project continued with environmental and social analysis, grid integration assessment, financial analysis, and regulatory analysis.
The broader project then showed how dramatically theoretical potential can narrow once other constraints are considered. While the geospatial analysis identified approximately 700 GWp (approx. 540 GWac) of theoretical potential, the grid integration assessment indicated a maximum of 5.3 GWac of utility-scale PV connectable to the grid by 2030, based on existing grid expansion plans.
This distinction is important. Geospatial analysis answers an early but fundamental question: “Where is there enough suitable space to investigate further?”
It does not replace grid, environmental, social, legal, or financial assessment. Instead, it provides a structured starting point for these analyses and helps avoid spending time evaluating locations that are unsuitable from the outset.
The results were ultimately presented to BAPPENAS (the Ministry of National Development Planning of the Republic of Indonesia), and made available to PLN (Indonesia’s state-owned utility company) and developers through interactive maps designed to reduce the effort required for preliminary site assessment.
Although this work focused on JAMALI, the underlying geospatial methodology is replicable in other countries and regions.
The core workflow is straightforward: Collect and harmonize data, apply qualification layers to exclude unsuitable areas, score the spatial potential, and translate the results into practical planning outputs.
A basic country-scale analysis can be completed relatively quickly using globally available datasets and Solargis proprietary data. However, the quality of the output improves significantly when quality local data sources are available.
For example, land-cover classes, protected areas, cultural heritage datasets, local development regulations, land ownership, land prices, regional plans, grid infrastructure, and specific risks such as erosion can all improve the analysis.
This is why geospatial mapping should not be seen as a one-size-fits-all exercise. The methodology is transferable, but the inputs should be localized wherever possible.
Local experts are essential for this step. They help adjust the scoring logic, interpret constraints, and align the methodology with real planning priorities, regulatory conditions, and project risks.
The project also assessed the potential for floating PV, which is particularly relevant in Indonesia, where land availability can be a major constraint on utility-scale solar development. Applying the regulatory maximum of 20% area utilization to suitable reservoirs, the analysis identified approximately 7.2 GWp of floating PV potential.
Floating PV deserves a closer look of its own, especially as some of Indonesia’s largest solar projects are being developed on reservoirs. We will explore this part of the analysis in more detail in a separate article.
This activity was carried out as part of the Solar Mapping and Development Plan, supported by the Energy Transition Partnership (ETP) and UNOPS to help Indonesia’s Ministry of National Development Planning (BAPPENAS) accelerate investment in the solar energy sector. The project was led by Trama TecnoAmbiental (TTA), with Solargis as one of the technical partners, alongside PT Quadran Solusi Enjinering, PT Inovasi Dinamika Pratama, and Environmental Resources Management (ERM).
The project outcomes are available on the project website.