Táto stránka zatiaľ nie je preložená do slovenčiny. Pozrieť si ju môžete v angličtine.
After solar irradiance received by the PV system, the module’s temperature is the most important factor to take into account for the efficiency of PV systems.
When PV modules get warmer, their conversion efficiency decreases.
In other words, PV modules are expected to provide the highest power output in moments of high solar irradiance, but low air temperature. Temperature is also a key parameter that influences how the PV systems are sized. To determine the maximum number of PV modules in a string, calculations are based on the lowest expected operating temperature (TLEO).
To calculate the temperature of PV modules, we therefore need to have accurate air temperature data as the main input for running our calculations. Simulation algorithms will then obtain the expected module temperature by adding the effect of solar irradiance, and the convective heat exchange due to wind, calculated for the specific PV system mounting type.
In this article, we share how Solargis has improved the accuracy of air temperature datasets we provide along with other parameters affecting solar energy power simulations.
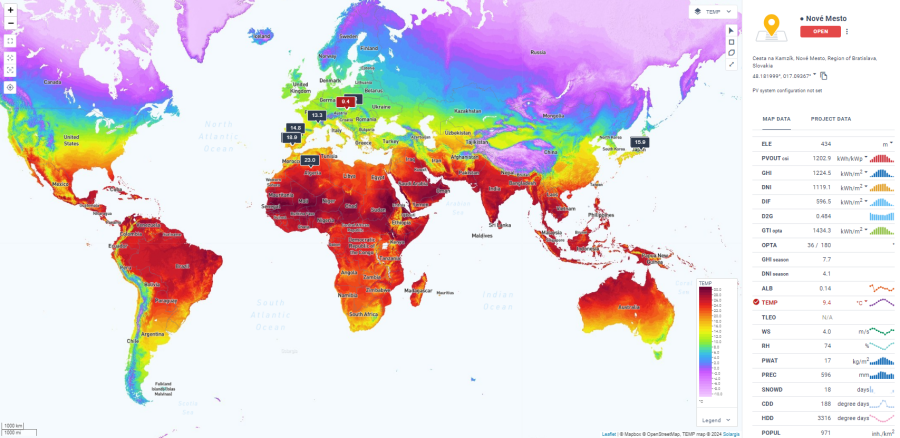
Temperature map by Solargis Prospect
Currently, reanalysis models provide the most accurate source of gridded air temperature data that can be used for running PV simulations at the global scale.
Reanalysis data, as we can almost imply by its term, is the result of "analyzing" Numerical Weather Prediction models (NWP) again. This can be done after collecting the real observations of the previously predicted periods. In other words, it's like calculating the model "to the past" instead of doing it "to the future" using the most updated observations.
The result is a comprehensive set of meteorological variables covering the world with relatively high temporal resolution (typically hourly) and low spatial resolution (typically tens of kilometers).
Having the most accurate global data inputs means relying on the right global weather models. One of the most prominent weather model prediction centers is the European Centre for Medium-Range Weather Forecasts (ECMWF).
Headquartered in Reading, UK, ECMWF can provide data for any site globally thanks to their powerful network of observations and high computation capacity with one of the largest supercomputers in Europe.
In particular, we have identified two models which are especially interesting for solar energy modeling purposes:
When talking about blending models, it is important to note that it is not as simple as running simple weighted averages from the input models. It requires expert eyes on the data to apply it effectively and knowing in which situations each model is expected to perform better.
After comparing both models with ground measurements from NOAA's Integrated Surface Database (ISD) network of stations, we can conclude that both ERA5 and ERA5-Land provide comparable accuracy in their long-term temperature averages.
However, ERA5-Land offers enhanced detail in land-surface variables and higher spatial resolution compared to ERA5. Due to the differences in vertical resolution, land-surface parameterization, and postprocessing, ERA5-Land helps eliminate fluctuations and exhibits smoother daily temperature profiles.
Besides, ERA5-Land helps mitigate the issue of missing coastal data, effectively filling the gaps in coastal pixels.
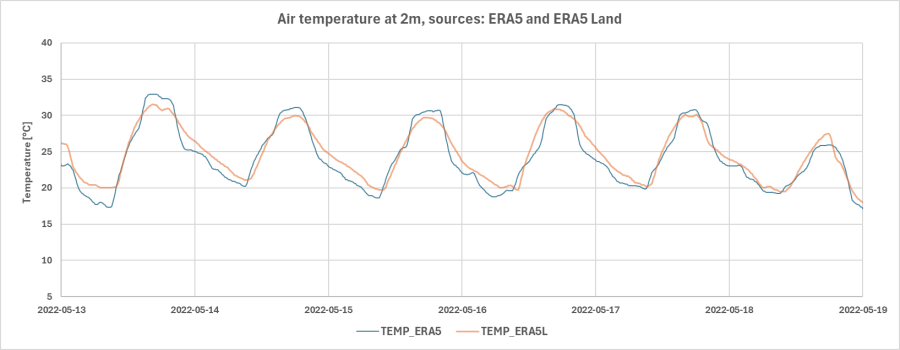
Hourly time series of air temperature derived from ERA5 and ERA5 Land in Belo Horizonte, Brazil, for the period of May 13-19, 2022
Blending ERA5 and ERA5 land models offers improved air temperature information making datasets well-suited for applications requiring high-resolution land-surface variables and smooth temperature profiles.
These efforts to improve site meteorological data are run in parallel with the improvements we constantly make on our satellite-based solar irradiance models that we have discussed in previous articles.
The blended version of ECMWF's ERA5 and ERA5-Land datasets is accessible in long-term averages (Solargis Prospect), Time Series, and TMY data (Solargis Evaluate).