

Zúčastnite sa nášho nadchádzajúceho webinára s názvom „Môžete sa spoľahnúť na namerané údaje?“ 27. októbra 2026 o 10:00 SEČ. Zaregistrujte sa tu
Since our Evaluate 2.7 release in March, we’ve shipped two more platform updates. Releases 2.8 and 2.9 take Solargis Evaluate beyond utility-scale ground mounts to commercial rooftops, bring tracker simulation closer to how plants operate on real terrain, and shorten the path from design to detailed engineering.
Solargis Prospect gains two new map layers: long-term hail risk and soiling losses. And if you already know what you need, you can now buy and renew both products online.
Two new map layers help you flag climate and environmental risks at the screening stage, before you invest time in detailed PV design.
See projected long-term energy losses from soiling for optimally tilted PV modules, anywhere in the world. The model accounts for natural cleaning by rain, showing where soiling stays a problem year-round and where rain keeps modules clean.
Read more about global soiling maps in our article here.
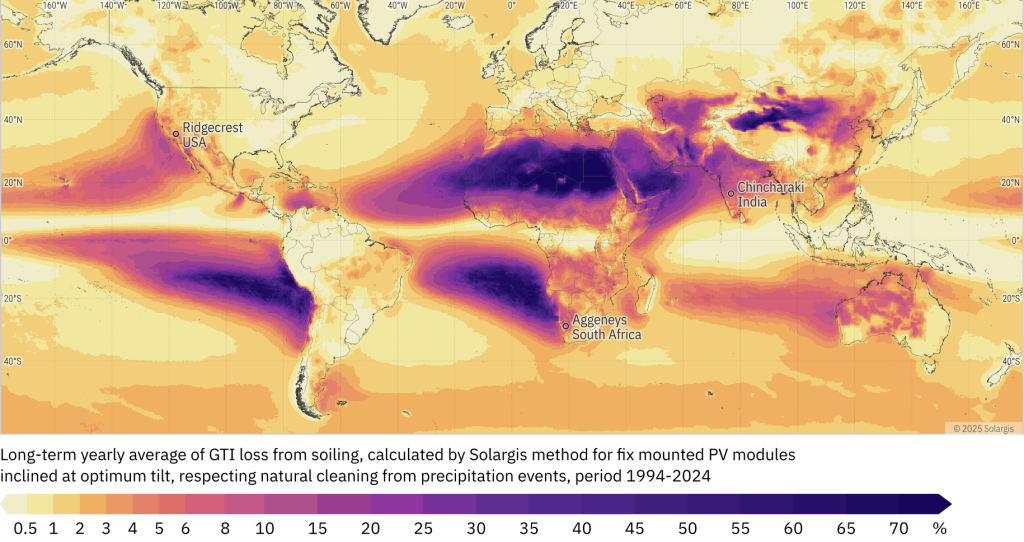
Image 1: Global summary map of data from the Solargis soiling loss model.
See the yearly average number of days with potential for damaging hail, aggregated per grid cell of about 28 × 28 km. Use it to compare candidate sites and to inform mounting, module, and insurance decisions.
Read more about global hail risk maps in our article here.
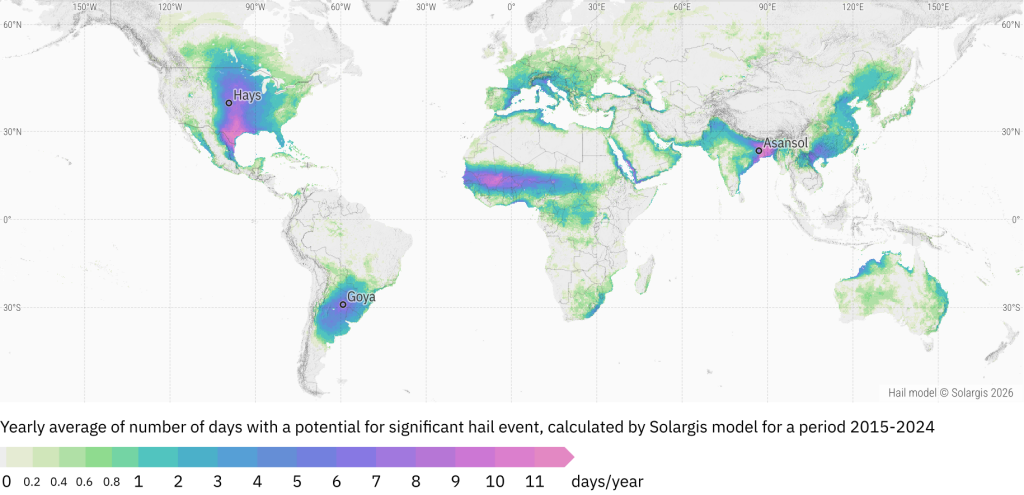
Image 2: Global map indicating the hail risk for PV assets
Both layers are available in maps, data pages, and Compare for Prospect Professional and Enterprise users.
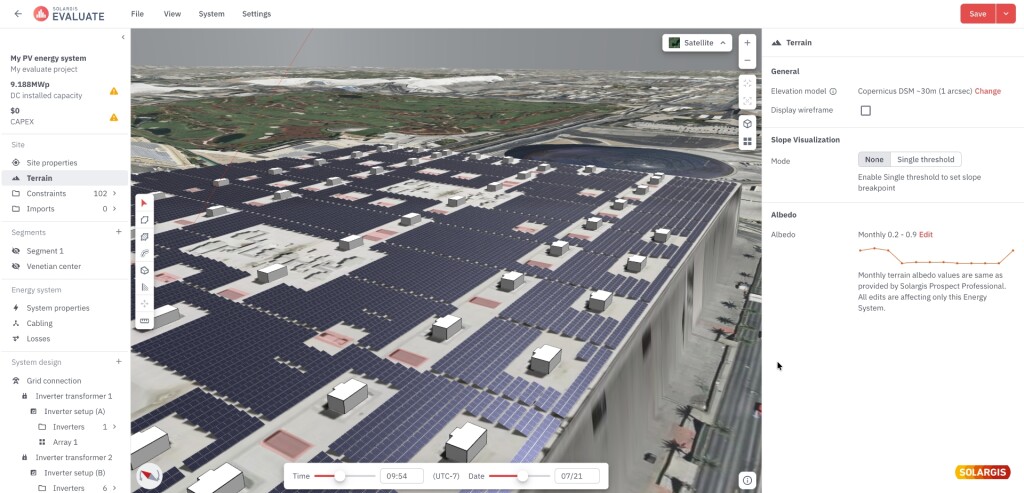
Warehouses, factories, data centers: you can now design commercial and industrial rooftop systems, on flat or single-pitch roofs, in the Solargis Evaluate Energy System Designer.
Define the roof plane by its slope and azimuth, or use your drone elevation model. Draw multiple roof segments, add arrays, and run the simulation.
Mark aisles, HVAC units, skylights, and elevator shafts as restricted areas with buffers, then move and copy them as you refine the layout.
On tight roofs, string overflow lets strings run across rows without table boundaries, so you can fit more modules into the space you have.
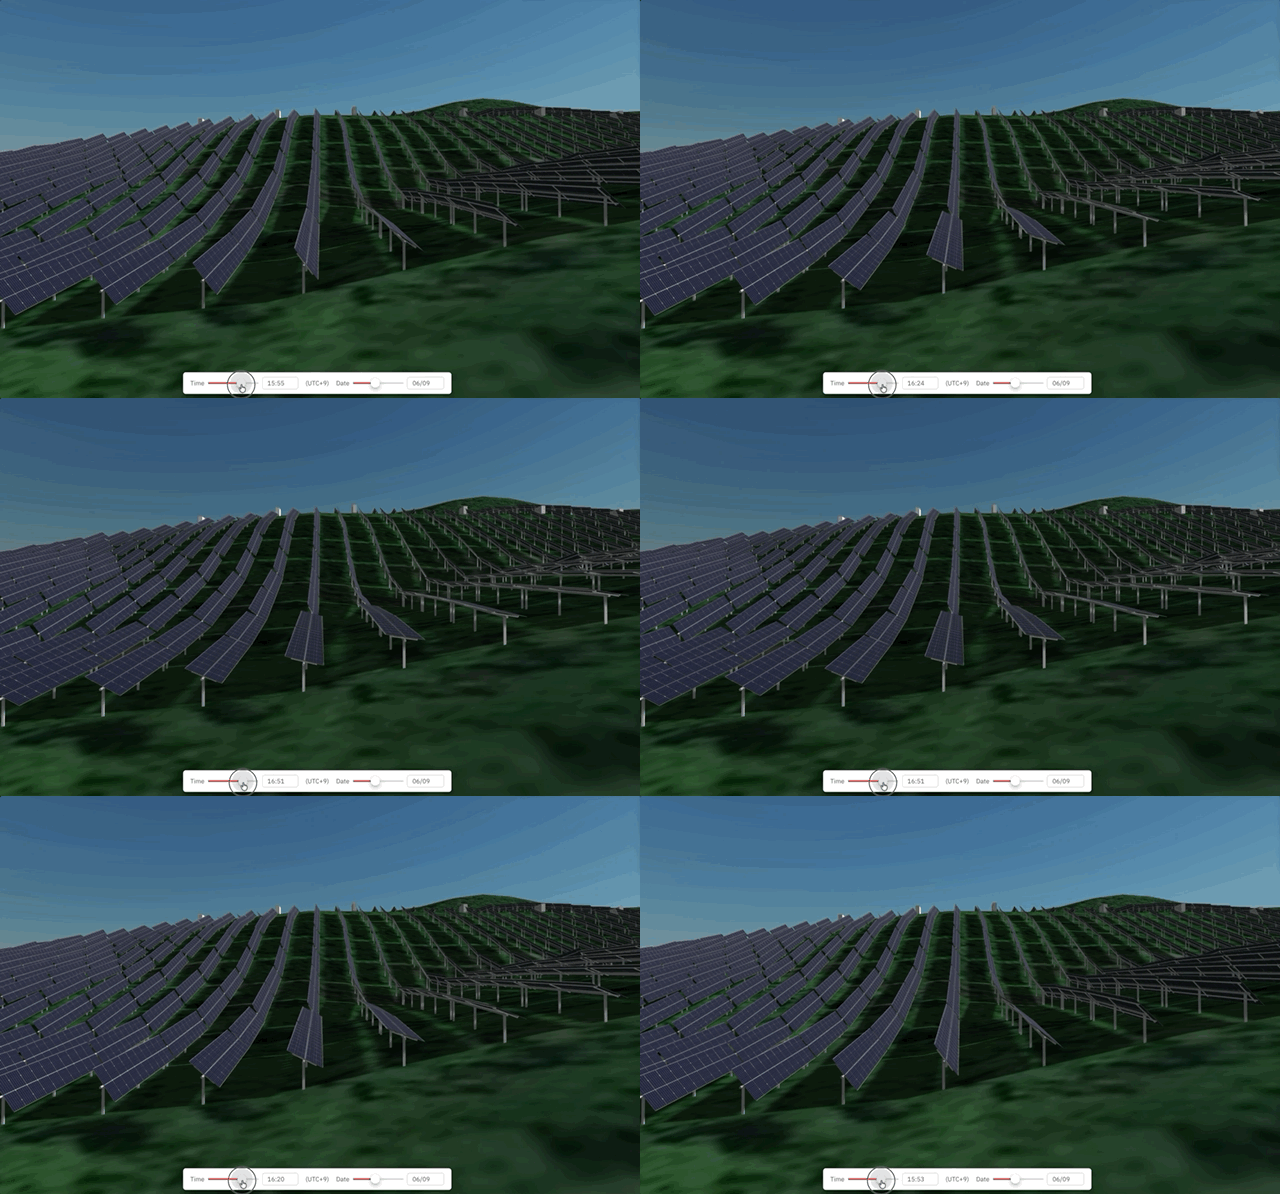
Is terrain-aware backtracking worth the extra cost on your site? Tracker manufacturers usually sell it as a paid add-on. Now you can answer that question before you request a quote.
In Evaluate, you can simulate your own layout with no backtracking, simple backtracking, or terrain-aware backtracking and compare the results.
Operators often retune backtracking once a plant is running, with different settings for morning and evening. You can do the same at the design stage: Evaluate sets the operational row spacing based on how much your terrain undulates, and you can adjust it separately for sunrise and sunset. Your physical row spacing stays untouched.
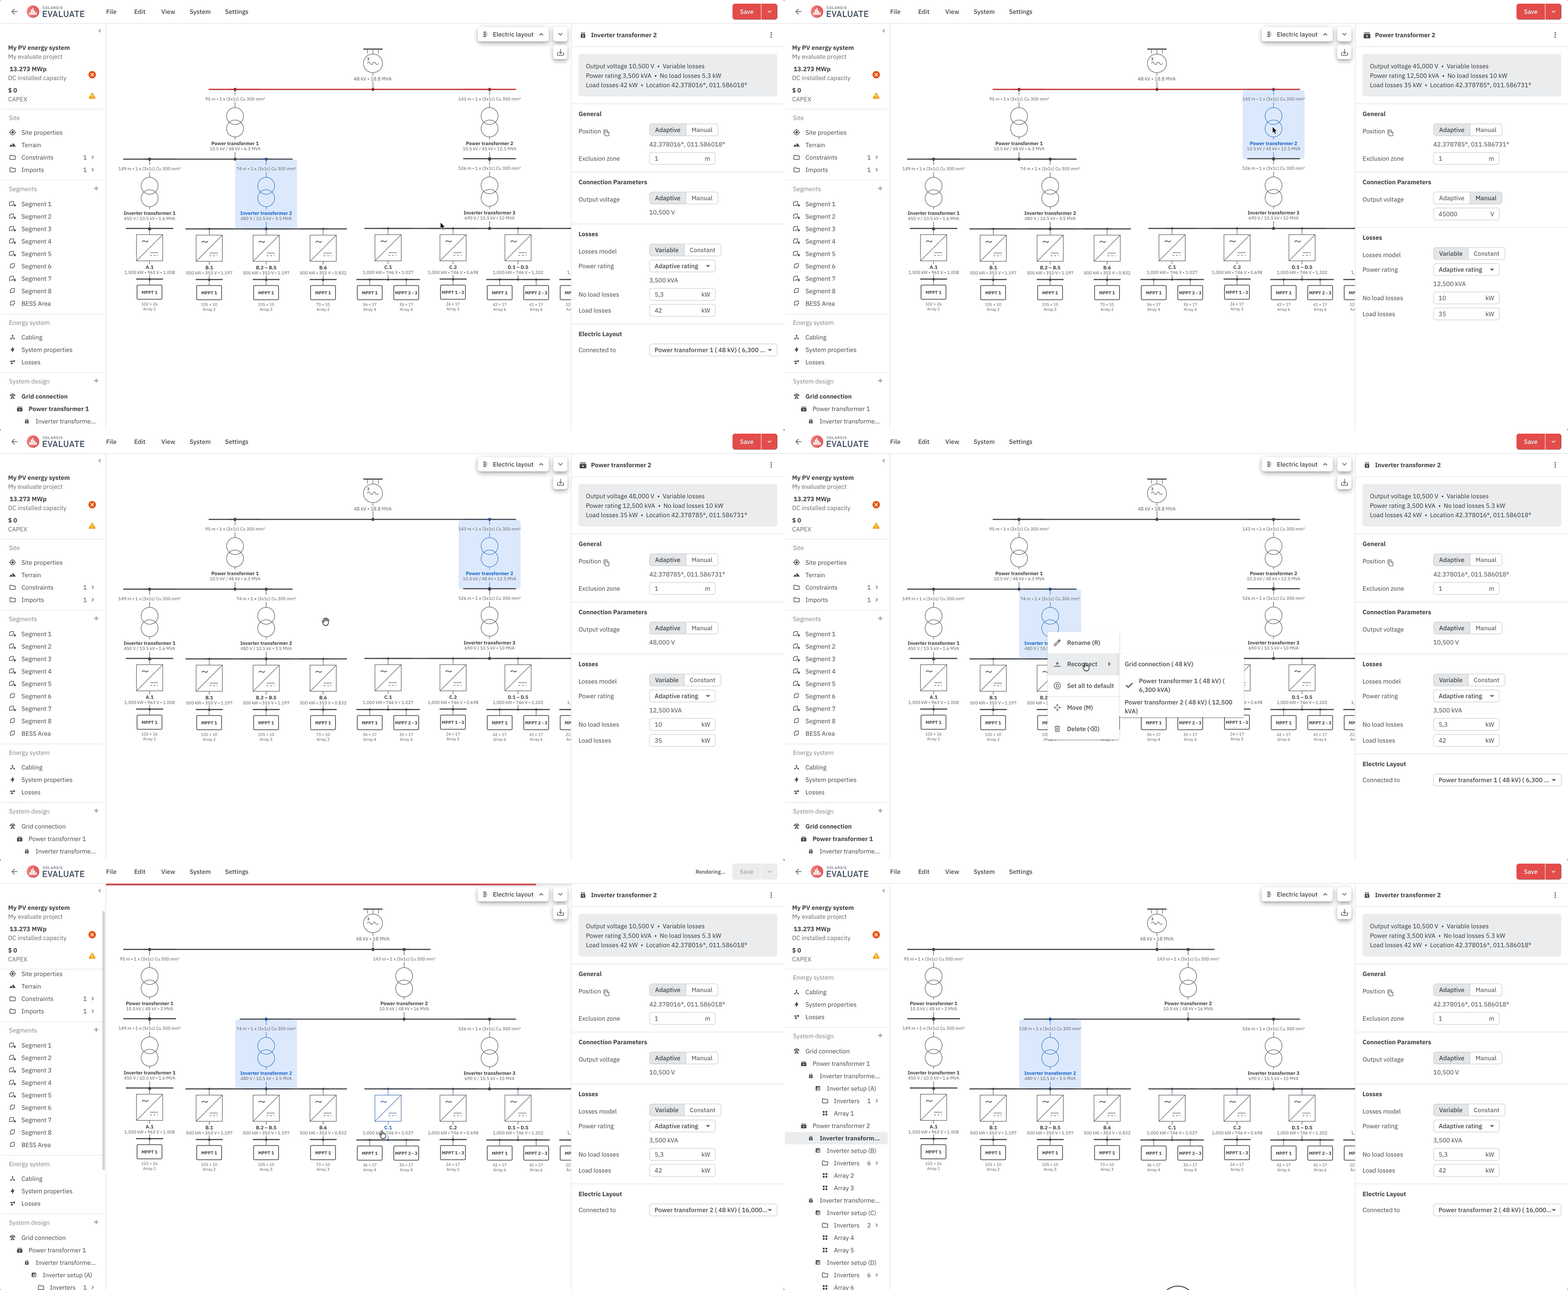
Review and edit your plant’s electrical connections in a schematic view, using the same objects, properties, and context menu you know from the 3D scene. Repeated inverters and MPPTs collapse into grouped nodes, which keeps large plants readable.
When a component’s output voltage doesn’t match its busbar, the busbar turns red right away. Transformer nodes show cable length and cross-section, taken directly from your cable routes.
You can export the diagram as an SVG for presentations and reports.
Hand your layout over to EPC, civil, and electrical teams without redrawing it. Export your design as a DXF file, with objects organized in layers and their attributes preserved. Pick the EPSG code your project requires, and the file arrives in that coordinate reference system.
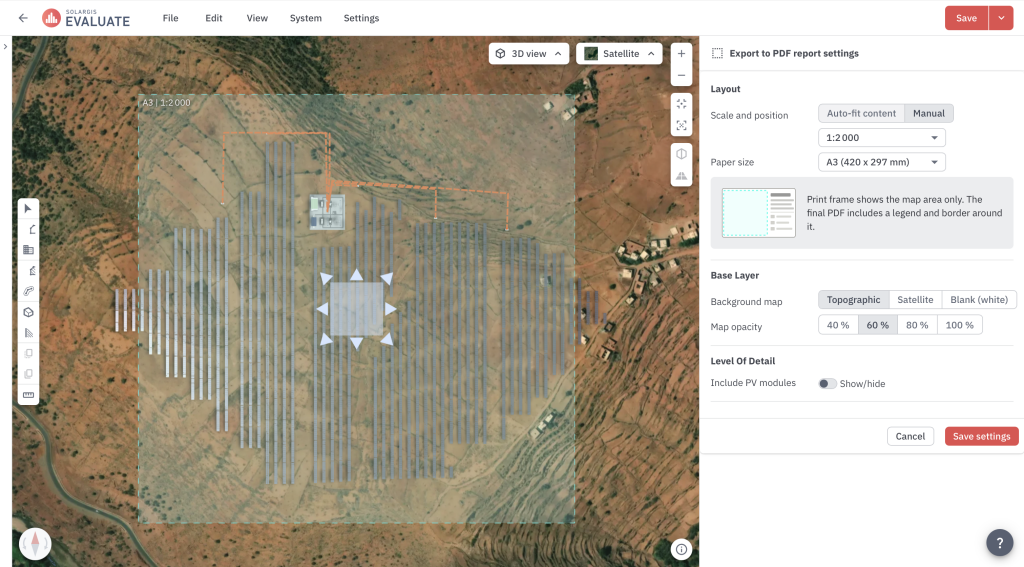
In activated projects, you can now export a print-ready PDF layout at any design stage, with no simulation required. Choose the scale, paper size, and base map, and find the file in Evaluate Downloads.
Model your cleaning schedule as it runs on site. Set specific cleaning days in each month based on your O&M contract.
Pick a manual or automated cleaning method from presets, or define its efficiency and speed yourself. Evaluate calculates how long a cleaning campaign takes for your plant size and warns you if the schedule creates a conflict.
For single-axis trackers, you can set a night stow angle and a separate snow stow angle that activates automatically when snow is detected, helping modules shed snow faster.
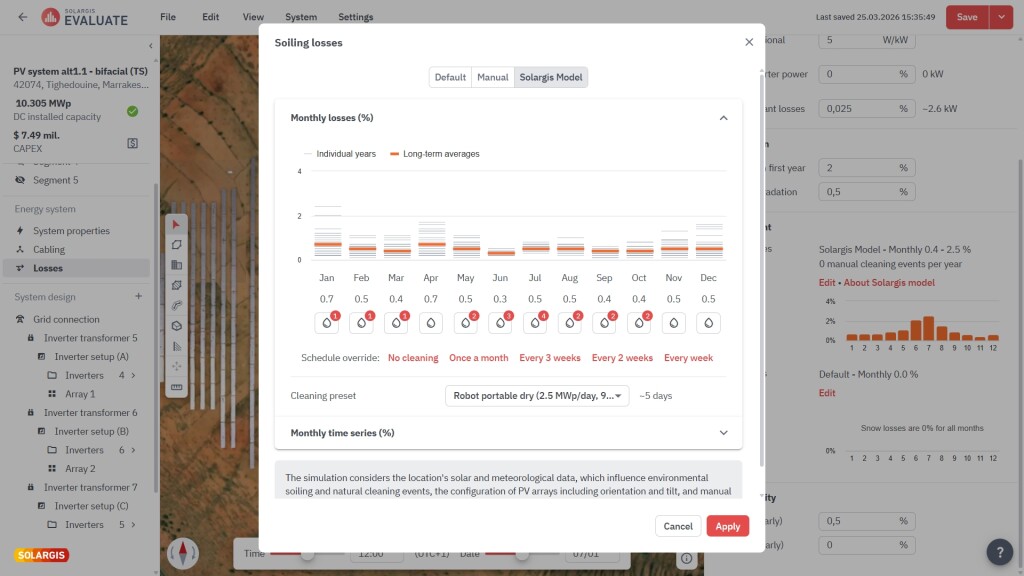
Read more about how we calculate snow and soiling losses.
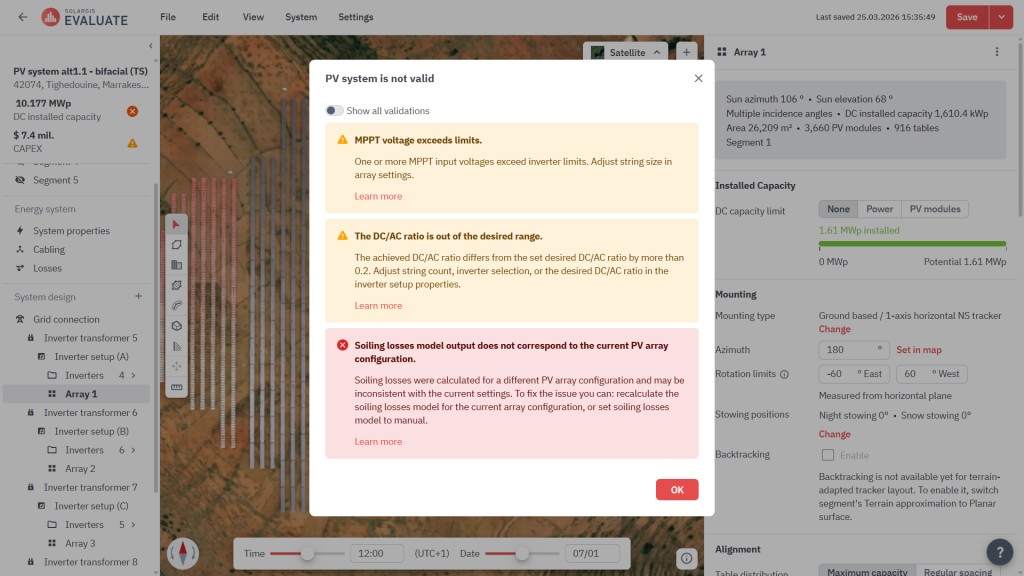
Validation now explains each failed check in engineering terms, points you to the exact setting to change, and links to documentation. Messages appear right where the issue happened, and for selected cases, you can apply the suggested fix with one click.
Alongside new features, we’ve also simplified the buying process. The new store in the Solargis platform lets registered customers buy and renew subscriptions directly.
Once your payment is confirmed, your subscription activates automatically, and a renewal continues right after your current period, with no gap in access.
Note: Only your company admin, the person who manages your Solargis subscription, can make purchases.
Releases 2.8 and 2.9 bring Solargis Evaluate to the projects where design assumptions are hardest to get right: commercial rooftops with limited space and many obstacles, tracker plants on undulating terrain, and sites where soiling and snow drive energy losses.
With rooftop design, simple and terrain-aware backtracking, the electrical layout view, CAD-ready export, detailed cleaning schedules, and guided validation, you can take a project from first layout to engineering handover with fewer manual steps and fewer surprises along the way. In Solargis Prospect, the new hail and soiling layers add two more risk factors to your site screening.
Want to see these new features on your own project?
Contact us or explore them directly in the Solargis platform.


