
Zúčastnite sa nášho nadchádzajúceho webinára s názvom „Môžete sa spoľahnúť na namerané údaje?“ 27. októbra 2026 o 10:00 SEČ. Zaregistrujte sa tu

Pablo Caballero
Aug 10, 2026
Toto leto postihujú lesné požiare a vlny horúčav rozsiahle oblasti Európy. Okrem svojich dobre známych dopadov na prírodu a kvalitu života ľudí predstavujú klimatické anomálie a extrémne javy neustálu výzvu pre výsledky pravidelného vykazovania výkonnosti fotovoltaických zariadení po celom svete.
Okrem toho si pozornosť zaslúži aj úplné slnečné zatmenie, ktoré sa má odohrať už o pár dní: pás úplného zatmenia prejde cez Grónsko, dotkne sa malej časti Islandu a prejde cez severnú časť pevninského Španielska až po Baleárske ostrovy.
Toto leto ovplyvňujú viaceré krajiny v Európe nezvyčajne vysoké teploty. Vplyv teploty na fotovoltaické články je dobre známy: moduly z kryštalického kremíka strácajú určité percento výkonu na každý stupeň teploty článku nad 25 °C. Okrem teploty vzduchu sú hlavnými faktormi ovplyvňujúcimi účinnosť premeny energie článkov rýchlosť vetra a slnečné žiarenie.
Vysoké teploty ovplyvňujú výkon elektrárne nielen z hľadiska účinnosti článkov. Meniče znižujú svoj výstupný výkon, keď vnútorná alebo okolná teplota prekročí bezpečné prahové hodnoty, čo je proces známy ako teplotné zníženie výkonu. Zároveň sa s teplotou zvyšujú aj straty v transformátoroch a kábloch.
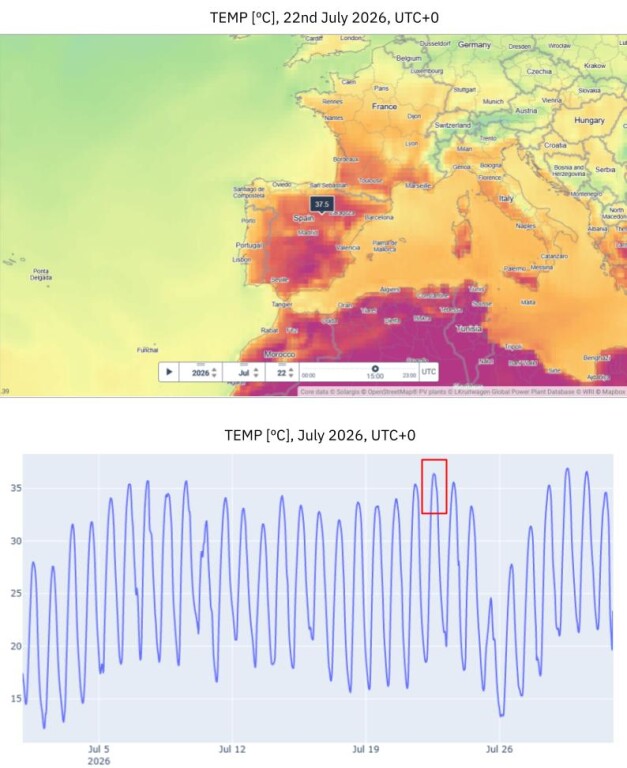
Obr. 1. Podľa modelu ERA5 dosiahla denná maximálna teplota vzduchu vo výške 2 m na vzorovej lokalite neďaleko španielskej Sorie 22. júla 2026 o 15:00 UTC hodnotu 37,5 °C, čo predstavuje absolútne maximum zaznamenané týmto modelom. Tri vlny horúčav, ktoré zasiahli Španielsko v priebehu júla, sú zreteľné aj na mesačnom grafe. Podľa Španielskej meteorologickej agentúry (AEMET) „vlna horúčav“ je definovaná ako obdobie trvajúce najmenej tri po sebe idúce dni, počas ktorých najmenej 10 % sledovaných staníc zaznamenalo maximálne teploty presahujúce 95. percentil ich radov denných maximálnych teplôt za júl a august v referenčnom období 1971–2000. Zdroj: Solargis Livemaps.
V júli 2026 došlo k dvom najväčším požiarom v histórii Španielska: jeden vypukol 16. júla v blízkosti La Mierla (Guadalajara), ktorý spálil približne 30 000 ha, a druhý vypukol 22. júla v blízkosti Burgohondo (Ávila), ktorý sa rozšíril do Madridu a Toleda a spálil približne 50 000 ha. Samostatný lesný požiar v blízkosti francúzskeho Bordeaux, ktorý spálil viac ako 70 000 ha, bol najväčším v krajine od roku 1949.
Pre rastlinu ovplyvnenú dymom je dôležité, koľko dymu prešlo nad ňou, aj keby bol samotný požiar ďaleko. Dym sa šíri a jeho vplyv na dopadajúce slnečné žiarenie možno sledovať prostredníctvom optickej hĺbky aerosólu (AOD).
Tento vplyv je jasne viditeľný pri pohľade na DNIc, priame normálne slnečné žiarenie za podmienok jasnej oblohy (jeden zo štandardných výstupov modelov slnečného žiarenia). Nárast AOD sa zvyčajne prejavuje poklesom DNIc, a to aj bez akéhokoľvek oblačného pokrytia.
Usadzovanie popola pridáva druhý efekt tým, že zvyšuje straty spôsobené znečistením. Piranometre na mieste fotovoltaickej elektrárne sú tiež ovplyvnené znečistením, čo sťažuje identifikáciu poklesov výkonu spôsobených týmto javom.
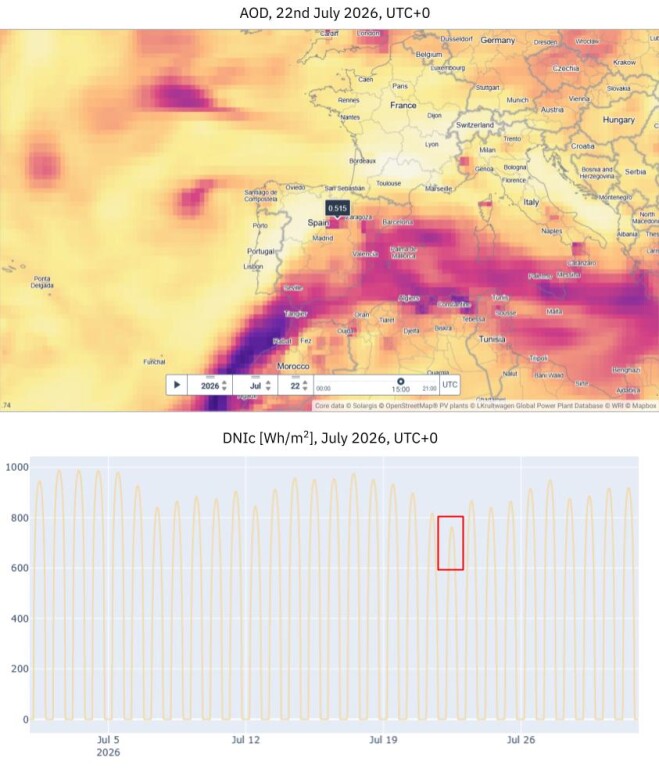
Obr. 2. Pre vzorovú lokalitu v blízkosti mesta Soria v Španielsku dosiahol AOD pri 670 nm v ten istý deň (22. júla 2026 o 15:00 UTC) podľa modelu CAMS hodnotu viac ako 0,5. Séria údajov DNIc za júl vykazuje v ten deň tiež výrazný pokles. Hoci prítomnosť aerosólov pochádzajúcich zo Saharskej púšte môže byť v južnej Európe počas leta pomerne bežná, mapa AOD pre vzorovú lokalitu v tento konkrétny deň ukazuje vysoko lokalizovaný oblak pokrývajúci okolitú oblasť, čo s veľkou pravdepodobnosťou súvisí s aktívnym lesným požiarom v Guadalajare. Zdroj: Solargis Livemaps.
Večer v stredu 12. augusta prejde cez severnú pologulu úplné zatmenie. Bude to mať osobitný význam pre fotovoltaické elektrárne v Španielsku, kde je podiel slnečnej energie v elektrickej sieti vysoký: pás úplného zatmenia prejde krajinou od Galície po Baleárske ostrovy, pričom úplné zatmenie nastane približne v čase 20:27 – 20:33. Bude to prvé úplné zatmenie viditeľné z pevninského Španielska od roku 1905. Túto udalosť zaznamenajú aj ďalšie fotovoltaické elektrárne po celej Európe, kde sa bude javiť ako čiastočné zatmenie.
Počas zatmenia intenzita slnečného žiarenia plynulo klesá a symetricky sa obnovuje. Jeho hĺbku a tvar je možné vypočítať s niekoľkoročným predstihom. V prípade 12. augusta je však hrozba energetickej straty relatívne malá, keďže úplné zatmenie sa zhoduje s obdobím tesne pred západom slnka, kedy je výkon už aj tak nízky. Napriek tomu je potrebné túto skutočnosť zohľadniť, aby bol pokles správne pripísaný a nebol mylne považovaný za prevádzkový problém alebo pripísaný iným zložkám strát súvisiacich so zdrojmi.
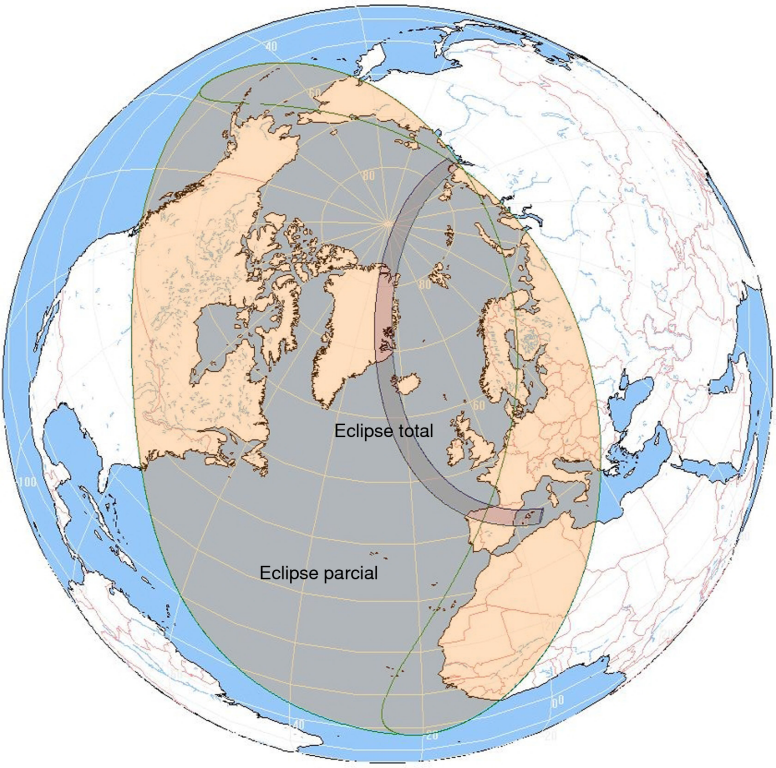
Obr. 3. Oblasti Zeme, z ktorých bude viditeľné zatmenie 12. augusta 2026. Svetlo sfarbená oblasť zodpovedá viditeľnosti čiastočného zatmenia, zatiaľ čo tmavý pás označuje miesta, kde bude zatmenie úplné (predchádzajúca vzorová lokalita v Sorii, uvedená v tomto článku, sa takisto nachádza v tomto páse). Zdroj: Španielsky geografický inštitút, IGN.
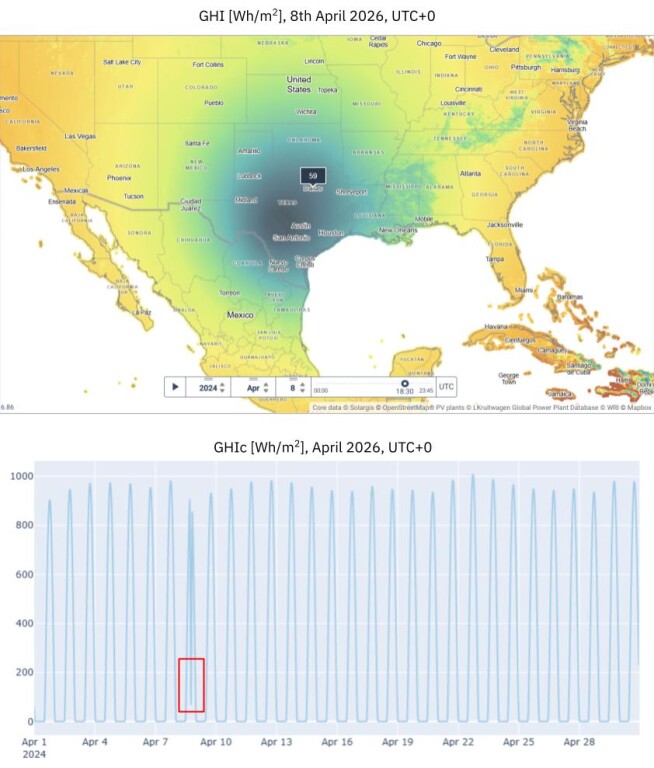
Obr. 4. Referenčný prípad: Ožiarenie GHI počas úplného slnečného zatmenia v Severnej Amerike 8. apríla 2024 v blízkosti Dallasu v USA. Na mape je viditeľná okrúhla škvrna spôsobená zatmením. Pri pohľade na mesačné rady GHIc sa očakáva pokles podobného tvaru 12. augusta 2026, hoci smerom k západu slnka a s menším vplyvom na celkové slnečné žiarenie. Zdroj: Solargis Livemaps.
Každá mesačná správa o výkone FV zariadení začína rovnakým porovnaním: nameraná produkcia oproti očakávanej produkcii. Keď sa obe hodnoty takmer zhodujú, nikto sa na nič nepýta. Ak však existuje rozdiel, skrýva sa za ním „príbeh“, ktorý je potrebné odhaliť.
V praxi má „očakávaná produkcia“ dva rôzne významy v závislosti od referenčnej hodnoty použitej na stanovenie očakávaní.
Správcovia aktív musia podrobnejšie preskúmať očakávaný výnos za konkrétne vykazované obdobie. Musia prepočítať očakávanú produkciu na základe skutočného slnečného žiarenia, aerosólov, teploty a vetra zaznamenaných v danom mesiaci. Ich kľúčová otázka znie: vzhľadom na to, aký výkon zdroj skutočne dosiahol, funguje elektráreň tak, ako by mala? Niekedy nasledujú ďalšie otázky: sledujú senzory na mieste skutočné poveternostné trendy, alebo potrebujú vyčistenie, kalibráciu atď.?
Majitelia a investori majú naopak na pamäti čísla zo správy o výnosoch: dlhodobý P50 stanovený pri finančnom uzavretí. Ich kľúčová otázka znie: dodržiavame ročný rozpočet? To vyvoláva aj ďalšiu otázku: musíme prehodnotiť naše dlhodobé očakávania na základe aktualizovaných údajov o slnečných zdrojoch?
Každá pravidelná správa o výkone je skutočne príležitosťou na aktualizáciu digitálneho modelu FV elektrárne a na preklenutie rozdielu medzi projektom a skutočnosťou. Keďže zmysluplné porovnanie je možné len vtedy, ak model FV elektrárne odráža skutočné podmienky v elektrárni, opätovné spustenie simulácií prináša cenné poznatky pre budúce vykazovanie. V praxi opätovná simulácia znamená aktualizáciu dvoch hlavných zložiek vstupných údajov do FV softvéru:
Hoci vlny horúčav, lesné požiare a zatmenia sú udalosti odlišnej povahy, do správy sa dostávajú rovnakým spôsobom: každá z nich môže byť „príbehom“ stojacim za rozdielom medzi nameranou a očakávanou produkciou.
Na posúdenie ich vplyvu je potrebné rozdiely analyzovať tak, že sa časť ovplyvnená zdrojmi oddelí od častí ovplyvnených sieťou a samotnou elektrárňou. V prípade udalostí opísaných v tomto článku, ktoré sa tento rok v lete odohrávajú v Európe, to znamená vychádzať aspoň z týchto dodatočných referencií:
Na pokrytie tejto potreby údajov je dôležité obrátiť sa na správne zdroje. Simulácia založená na vlastných senzoroch elektrárne je dôveryhodná len do tej miery, do akej sú dôveryhodné tieto senzory, a práve počas extrémnych udalostí, ako sú tieto, je ich spoľahlivosť najviac spochybňovaná: znečistený pyranometer alebo meteorologická stanica vystavená tepelnému stresu nikdy nie je sama o sebe spoľahlivým referenčným zdrojom.
Satelitné modely slnečného žiarenia a produkty reanalýzy počasia od spoločnosti Solargis tento problém riešia už svojou konštrukciou: pochádzajú z nezávislého zdroja a konzistentne poskytujú rovnaké hodnoty. Sú priebežne aktualizované novými vstupnými údajmi, čo umožňuje pravidelné vykazovanie kľúčových ukazovateľov. Hoci je ich rozlíšenie hrubšie ako v prípade bodového senzora, spoľahlivo zachytávajú trend: dennú krivku vlny horúčav, nárast a pokles AOD alebo načasovanie a hĺbku zatmenia.
Väčšina fotovoltaických elektrární je postavená tak, aby odolala budúcim vlnám horúčav, lesným požiarom a zatmeniam. Skutočnou otázkou je, či správy, ktoré nasledujú po takýchto udalostiach, dokážu zainteresovaným stranám povedať, čo sa skutočne stalo a čo by mali odteraz očakávať.