Global Horizontal Irradiation (GHI) is the most important weather factor affecting the energy production of solar photovoltaic power plants. Therefore, having reliable information on recent values of GHI is critical for understanding whether your solar portfolio is performing optimally or not.
Maps showing recent values can be used as a preliminary and approximate reference, and they can help identify the need for running a more detailed energy assessment in these cases:
You find out that map values are not falling within the range of your previously expected values.
Then you might need a new estimation of the expected solar resource in the long-term, including an updated monthly variability analysis.
You find out that map values are not aligned with your on-site observations and the actual energy generation.
Then you might need a review of your on-site sensors, together with a deeper look into possible sources of underperformance in the PV plant.
Receive vital solar and meteorological events for PV performance impact in detailed monthly PDFs that contain data and maps.
Increase accountability and transparency in asset management, reduce time spent in preparing reports and equip your team with reliable data for effective communication with stakeholders.
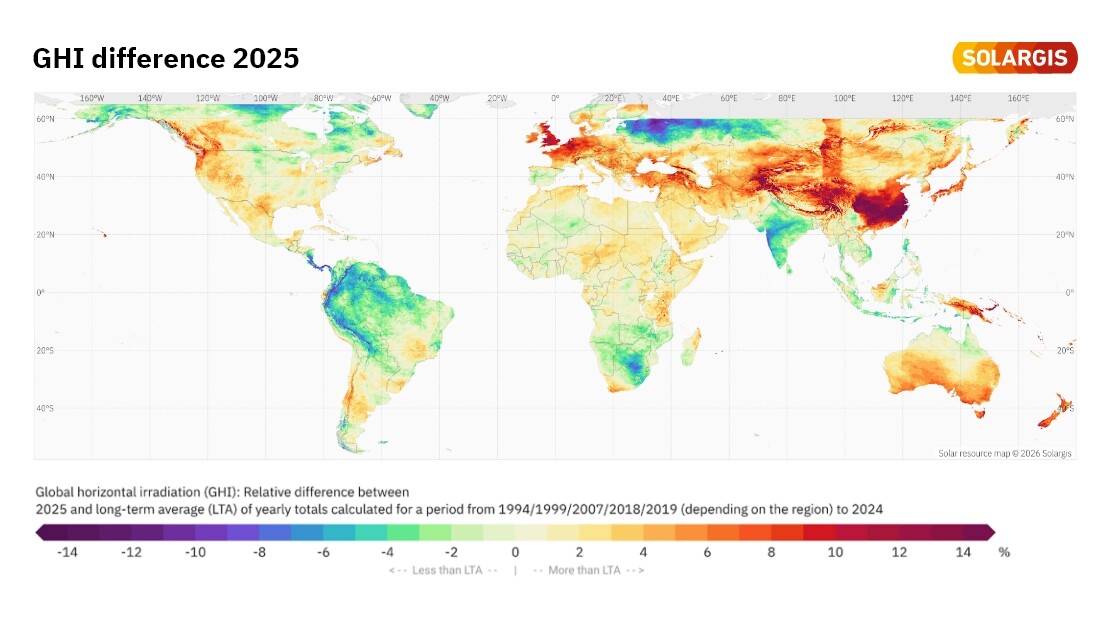
As every year, we bring you a map summarizing last year’s global horizontal irradiation (GHI) anomalies, highlighting how much regional weather conditions diverged from long-term averages (LTA). These maps help project developers, asset managers, and investors understand how atmospheric variability may have influenced PV performance worldwide.