Most PV projects rely on a single P50 value to represent expected annual energy yield. But one number can't tell the whole story and it certainly can't capture the range of outcomes your project might face.
Watch this webinar to see how Solargis calculates PV yield uncertainty backed by industry-leading solar and meteorological data, proven modeling approaches, and transparent methodology.
More accurate energy yield assessments start with closing the gap between satellite model data and ground measurements.
Watch this webinar to learn how the site adaptation process works and what best practices for ground measurements can do for the accuracy of your energy yield assessments.
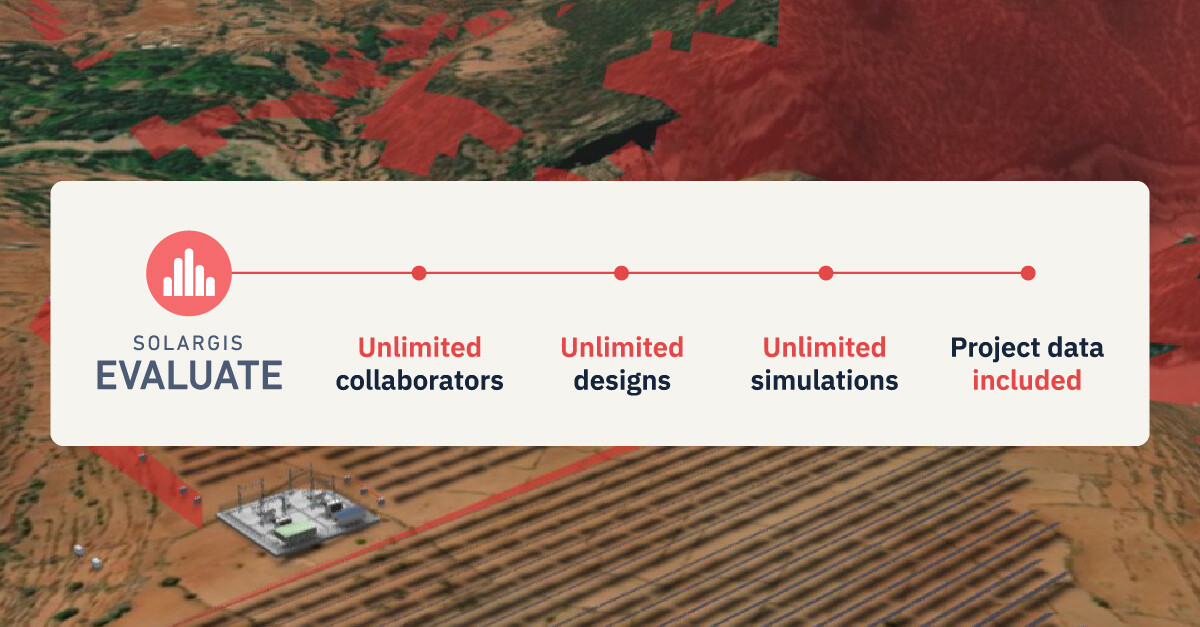
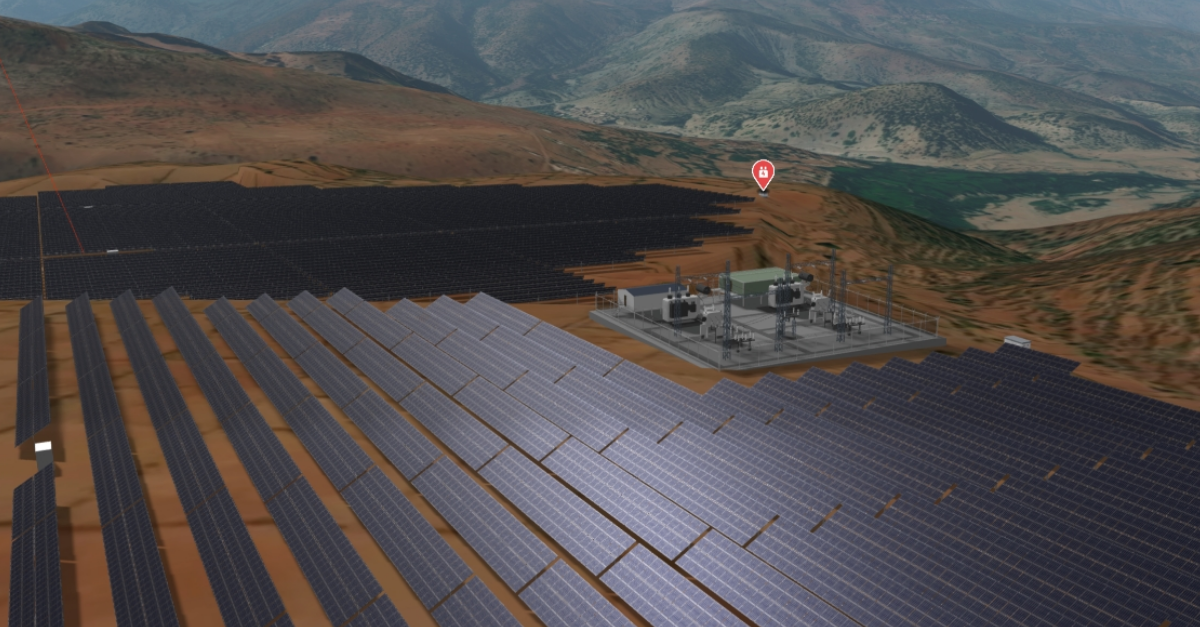
Find out how to simplify solar project feasibility with Solargis Evaluate. Our team explains how Solargis TMY data supports reliable early-stage decisions, and highlights the key benefits of the Evaluate subscription.
Watch this webinar to learn how to create unlimited PV designs and run unlimited number of energy yield simulations.
Are you still juggling multiple applications for PV evaluation? You don't have to.
During this webinar you will get a chance to see why Evaluate represents a new way of working; no more siloed tools, no more wasted effort. Just a single, trusted platform for confident solar project evaluation.
Our expert team gives actionable tips on how to avoid the negative surprises of extreme weather and shares some of our customers' best practices.
The new version of Solargis Analyst (version 1.4.2) includes an updated database structure that is crucial for all upcoming new features and parameters.
In this webinar, we will present how 1-minute granularity data can also help with optimal sizing of batteries and replacement strategy— even during the initial design phase.
In this webinar, we will show how to share datasets between the company with saved flags and export the data to make your workflow more efficient and productive.
During this webinar, we will show how to run this type of analysis to help gain confidence in the performance values of solar power plants.
Calculate different statistic values or probabilistic scenarios (P50, P75, P90…), explore typical daily profiles of solar resource data and see common weather patterns with the help of Solargis Analyst.
See how Solargis Analyst can help with data management in a very simple way, gathering the data in one place with a harmonized format.
During this webinar, we introduce another benefit of using Solargis Analyst: data comparisons between different renewable energy sources, e.g. generated by wind and solar power plants.
How do 100.000 lines of GHI in the dataset look like? In this webinar you can learn how you can visualize multiyear datasets with various type of graphs with Solargis Analyst.