Products
menu item
Prospect
Quick estimate of PV site's solar potential
menu item
Evaluate
Time Series & TMY data for energy modelling
menu item
Monitor
Real-time PV output assessment
menu item
Forecast
Solar power output forecast for up to 14 days
menu item
Analyst
Simplified & unified solar data management
menu item
Integrations
Automate delivery of Solargis data
Use cases
menu item
Site selection
Find the right solar project location
menu item
Energy yield simulation
Analyze potential gains and risks
menu item
Optimizing power plant design
Find optimum power plant design
menu item
Real power plant performance
Discover the true output
menu item
Power output forecast
Predict solar project energy output
menu item
Ground data verification
Verify quality of solar & meteo measurements
Solar Resource & Meteo Assessment
Detailed solar resource validation and assessment
Site Adaptation of Solargis Models
Combining satellite data with on-site measurements
Quality Control of Solar & Meteo Measurements
Correction of errors in ground-measured data
Customized GIS Data
Customized Solargis GIS data for your applications
PV Energy Yield Assessment
Estimated energy uncertainties and related data inputs
PV Performance Assessment
Energy estimate for refinancing or asset acquisition
PV Variability & Storage Optimization Study
Understand output variability across wide geo regions
Regional Solar Energy Potential Study
Identification of locations for solar power plants
Our expertise
How our technology works
Methodology
How we transform science into technology
API & integration
How to integrate Solargis data via API
Product guides & documentation
Release notes
Success stories
Blog
Ebooks & Whitepapers
Webinars
Publications
Events
Free Maps & GIS Data
Solar performance maps
About Solargis
Partners
ISO Certification
Careers
Trusted by companies all around the world#
Logo metka
Logo yellow door
Logo neoen
Logo solartec
Logo rodina
Logo sgurr
Benchmark your planned performance with reality

Benchmark your planned performance with reality

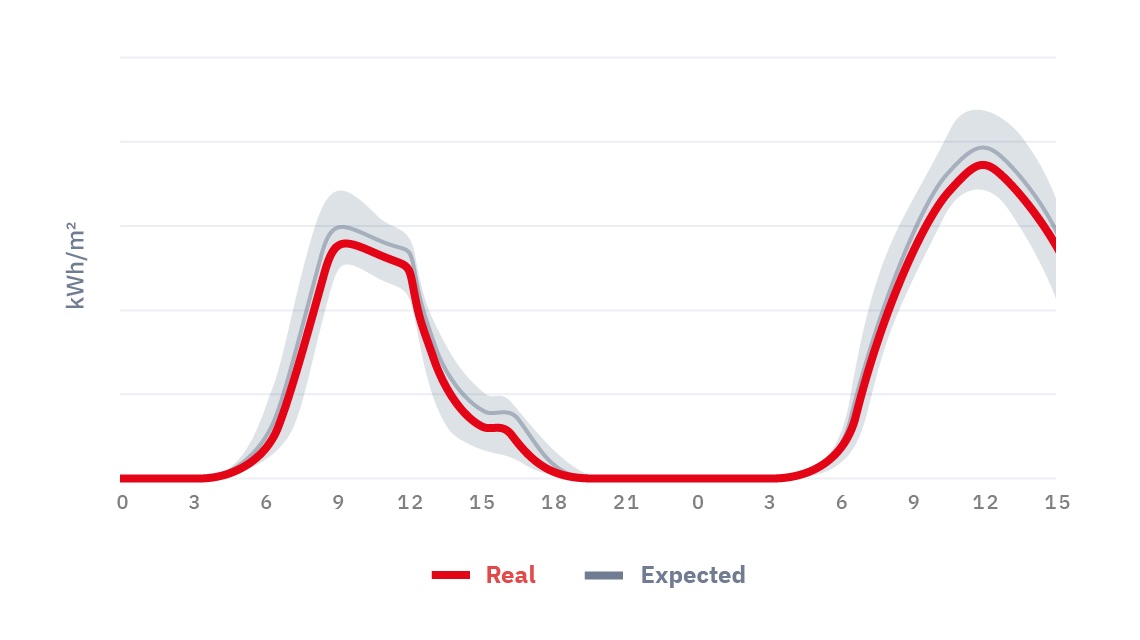
Operational solar power plants require systematic performance monitoring to ensure they are delivering against expectations. With Solargis, you can compare your power plant's actual performance to predictions made during the design phase.

This will help you uncover potential long- or short-term issues if the real output does not match expectations.

Discover the root causes of underperformance

Discover the root causes of underperformance

If a plant is underperforming, you need to find out why the actual output does not match the expectations.

Solargis can help you determine if lower production is caused by weather or solar conditions or another issue such as equipment failure or technical problems. 

This will give you the certainty to go ahead and make adjustments.

Run continuous reports for multiple sites

Run continuous reports for multiple sites

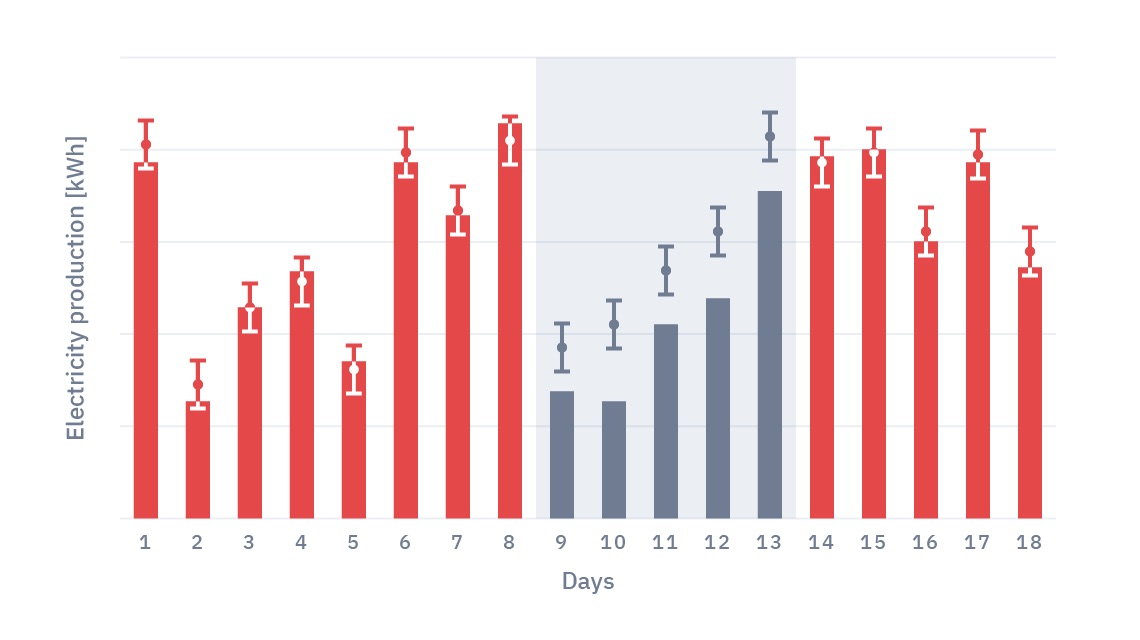
In the past, operators of large PV plant portfolios lacked unified reporting where they could compare “apples to apples” and present the results to the executive team in an easy-to-understand way.

Solargis provides continuous performance reporting for your bank, investors, and other stakeholders so they can see how the project is progressing.

The reports come in the same format and with the same parameters, making it easy to compare the performance of multiple sites in your portfolio.

Related products and services#

One solar data source for all sites
Gap- and error-free solar radiation data
Minimize meteo station inputs uncertainty
Benchmark planned performance with reality
Near real-time PV output assessment

Data-driven insights from our PV Performance Assessment report conducted after months or years of the plant's operation will help you optimize its performance.

The report also provides a revised and more accurate long-term energy yield estimate for refinancing or new asset acquisition purposes.

The PV Variability & Storage Optimization Study delivers statistical data and insights to project developers needed for designing and managing PV-plus-storage systems.

The study provides the most realistic data on PV power generation for grid integration analysis.

This web service provides recent historical data for solar power plants in operation.

The API provides flexibility to request solar radiation, meteorological parameters for various time aggregations.

You can also receive PV energy production data when you provide configuration of a PV energy system in your data request.

Useful resources#

Shift Energy Japan uses Solargis Monitor to track and assess its projects’ financial performance
Solargis Monitor

Shift Energy Japan uses Solargis Monitor to track and assess its projects’ financial performance

Shift Energy Japan uses Solargis Monitor as a replacement for the scarce, publicly available data to track and assess its projects’ financial performance and deliver key insights into operations.

How satellite model data help with storage applications

How satellite model data help with storage applications

In this webinar, we will present how 1-minute granularity data can also help with optimal sizing of batteries and replacement strategy— even during the initial design phase.

Solar power performs amid hottest year on record in 2023

Solar power performs amid hottest year on record in 2023

Solargis has analyzed the annual performance of solar irradiance for 2023, revealing the trends and variations of solar irradiance across the globe.

Trusted by 1200+ organizations worldwide#

9 000+

Projects supported by our bankable solar & meteo data, software, and services every year

24

Years of experience with solar projects and improving industry standards

99%

Coverage of the world’s population with 30 years of solar and meteorological data

“Through integrating Solargis Monitor into our operations, our investors have a clear and accurate understanding of how their assets are performing in real-time.”
Louis Klépal
Deputy General Manager
Shift Energy Japan
Logo sej
1 / 3
Logo metka
Logo yellow door
Logo neoen
Logo solartec
Logo rodina
Logo sgurr