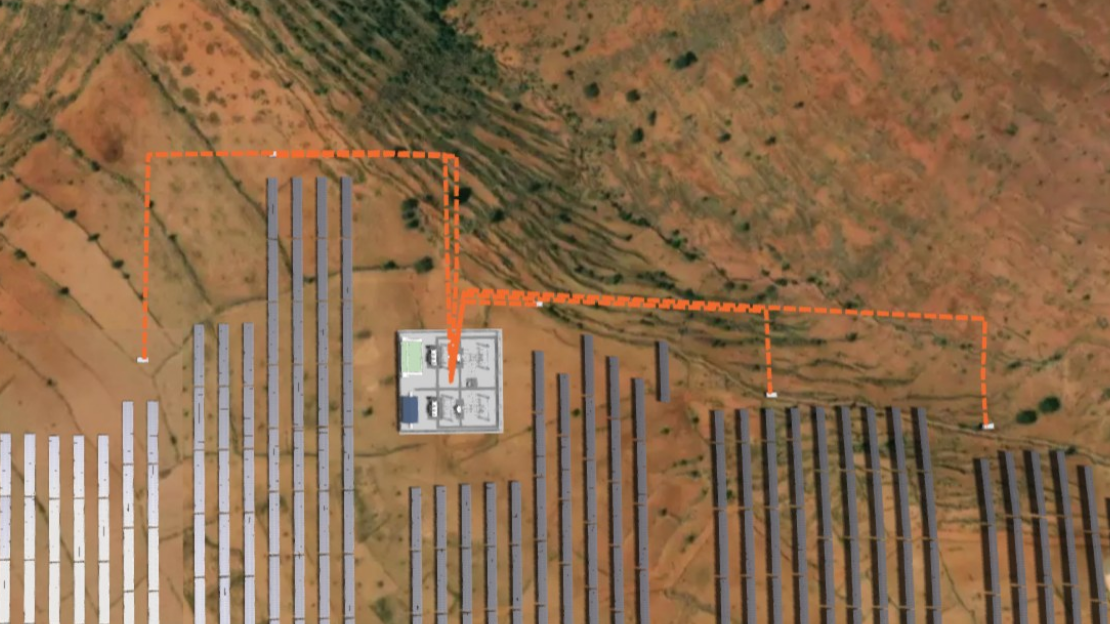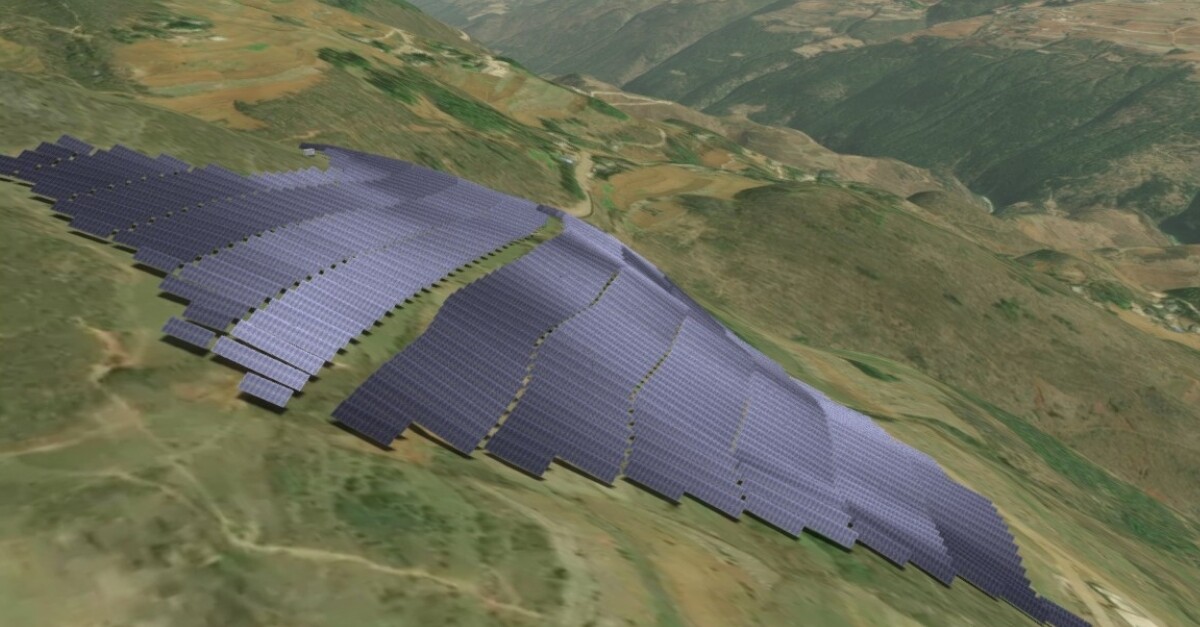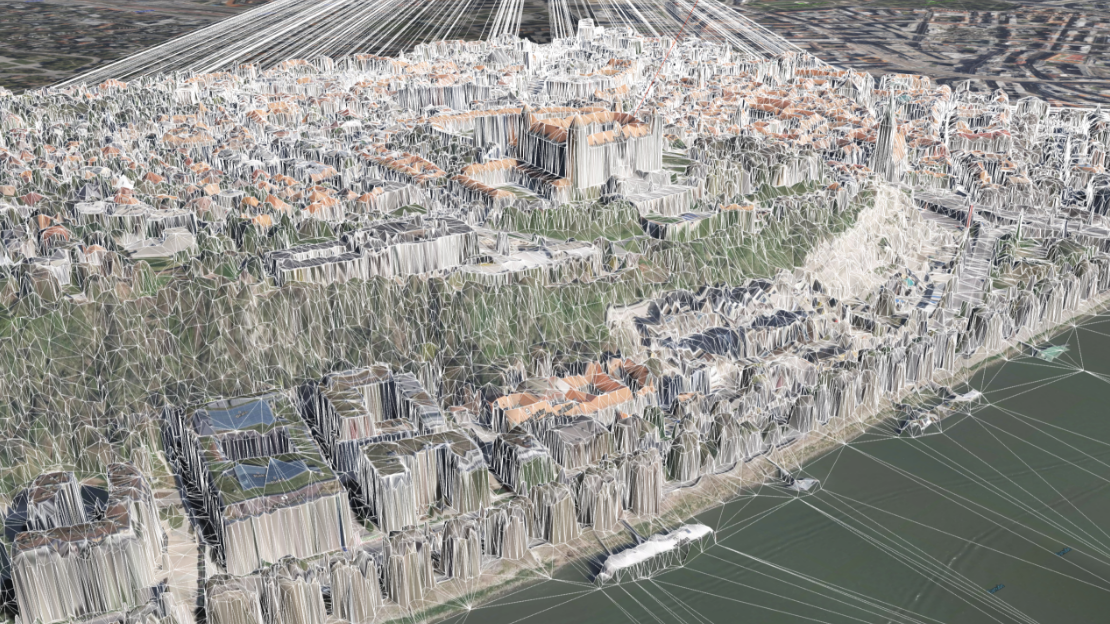
Terrain is a critical input for energy simulations as it dictates the geometric and physical reality of a power plant's performance. Since utility-scale PV projects are often built on complex terrain, not perfectly flat plots of land, taking into account specific terrain features such slopes, hills, valleys or ridges is a key factor for ensuring the accuracy of PV simulations and subsequent energy yield estimates.
Depending on location and conditions, satellite-based solar resource data typically have uncertainty in the range of about 4–8%. With high-quality ground measurements and proper site adaptation, that uncertainty can often be reduced to around 3–5%. This reduction may look small but it is commercially meaningful for many utility-scale PV projects.
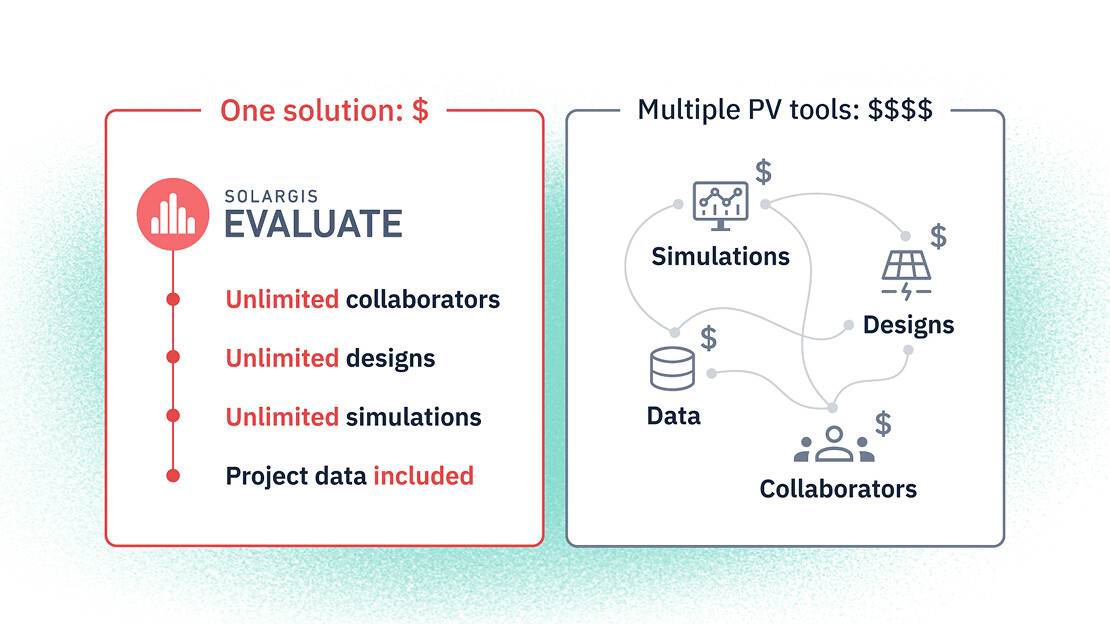
We’ve just added another layer of precision to Solargis Evaluate. Following the recent launch of snow loss calculations, soiling losses are now also part of our energy yield simulation toolkit – helping developers, investors, and technical advisors model real-world PV performance more accurately.
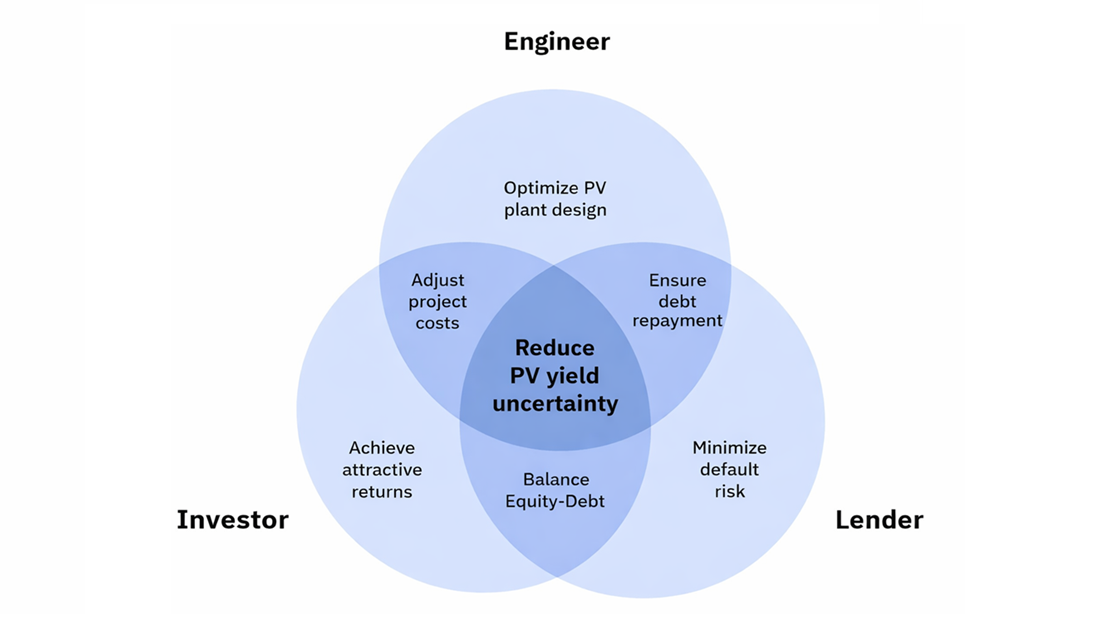
Every solar PV project usually starts with one simple number: expected annual PV yield. At first glance, this number looks clear and precise. In reality, however, it always comes with uncertainty. How a project team deals with this uncertainty matters a lot. It influences engineering design, investor expectations, and bank financing, often in ways that only become visible late in the project lifecycle.
Approximately one year ago, we launched Solargis Evaluate packed with features for complex site assessment, PV system design, energy yield simulation, analysis, and reporting, all under one roof. Our latest Evaluate 2.7 release is introducing major improvements in the PV system designer, data analysis, and bankable reports. Get to know the latest feature updates.
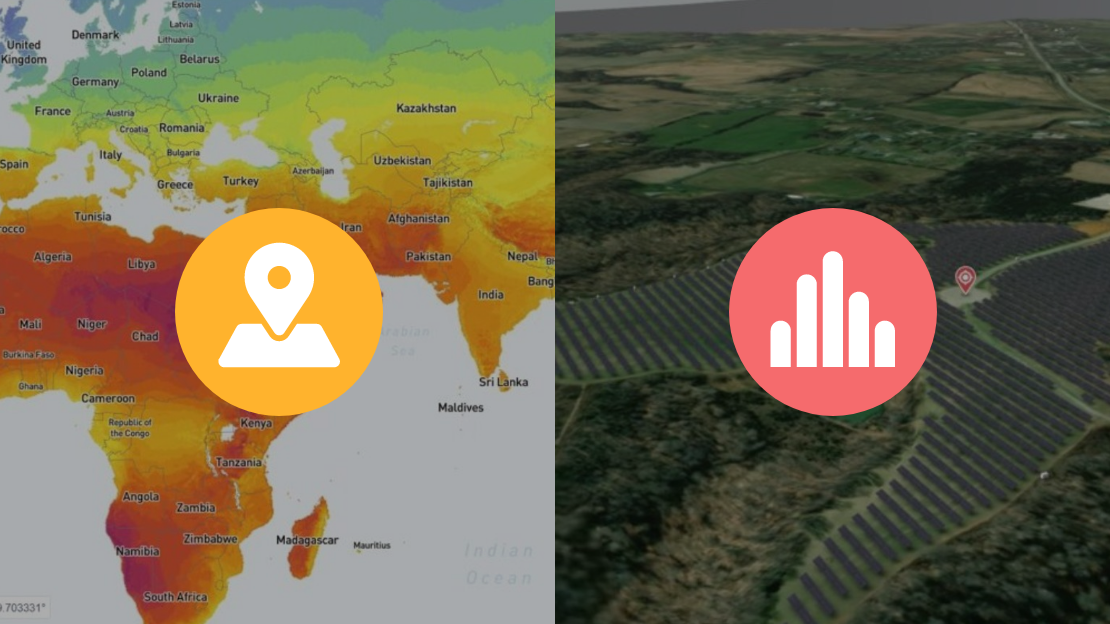
Solargis Prospect and Solargis Evaluate are essential in the pre-feasibility and feasibility phases, but they serve different purposes. Many of our customers ask how the two products differ, how they fit into the project development process, and whether – or when – to transition from Prospect to Evaluate. In the article, we'll walk you through the role of each solution and help you make the right product decision.
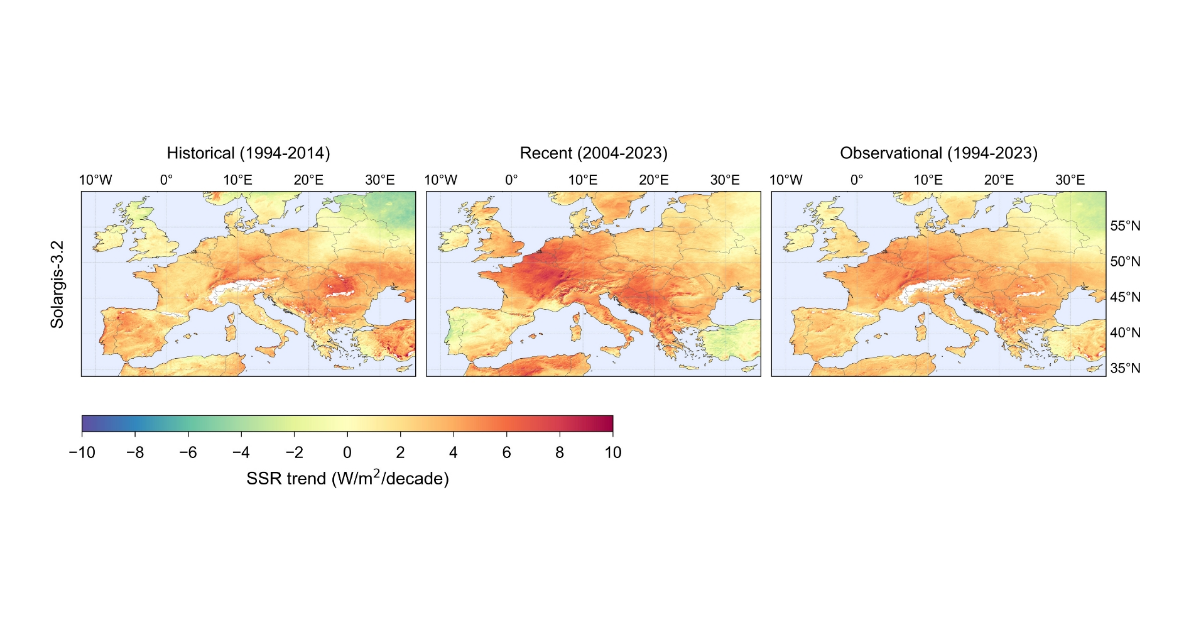
A new peer-reviewed study, conducted in collaboration with Solargis experts and the researchers from the University of Murcia and the University of Málaga, powered by Solargis data, evaluates the impact of clouds and aerosols on surface solar radiation (SSR), identified as the two main drivers of long-term solar trends in Europe.
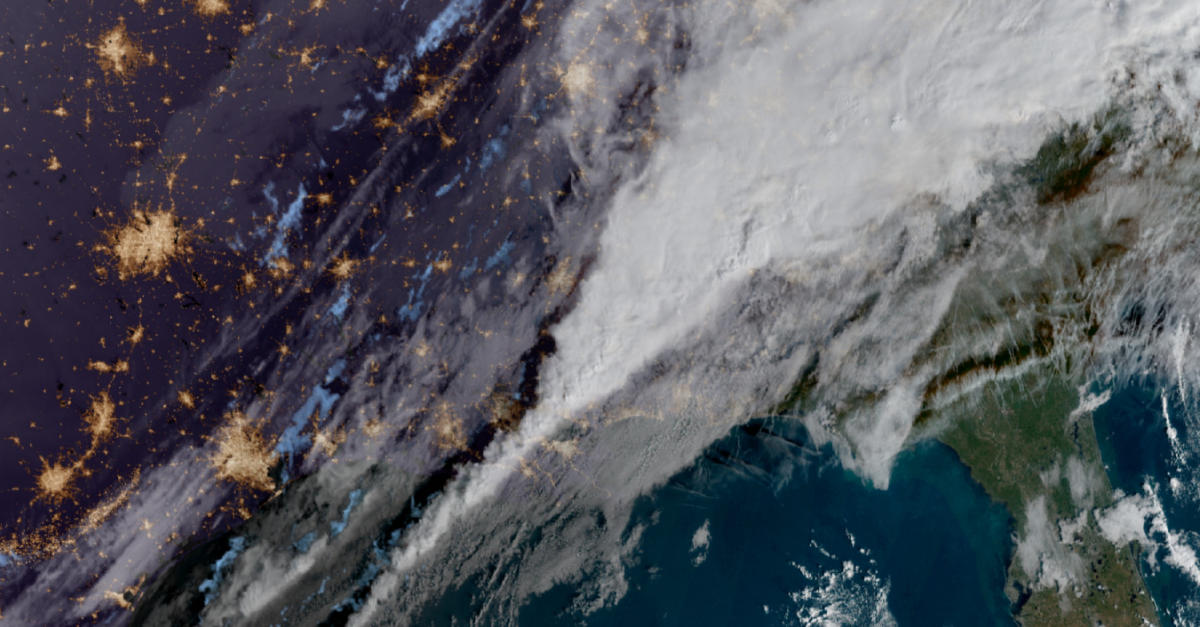
Great news for our North American clients. From now on, the Solargis Forecast platform provides early warnings for one of the most damaging weather hazards for solar power plants: Hail forecasting - crucial especially in regions with frequent severe storms. As the continental United States is one of the areas most affected by hail, we’ve launched this update for this region first, with plans to expand coverage in the near future.
Twelve months have passed since we launched the new Solargis Evaluate platform. We are proud to say that since then, we have made numerous great product updates and Evaluate has grown to be an even more powerful solution for complete PV project design and evaluation. Learn about the most important updates and new features.
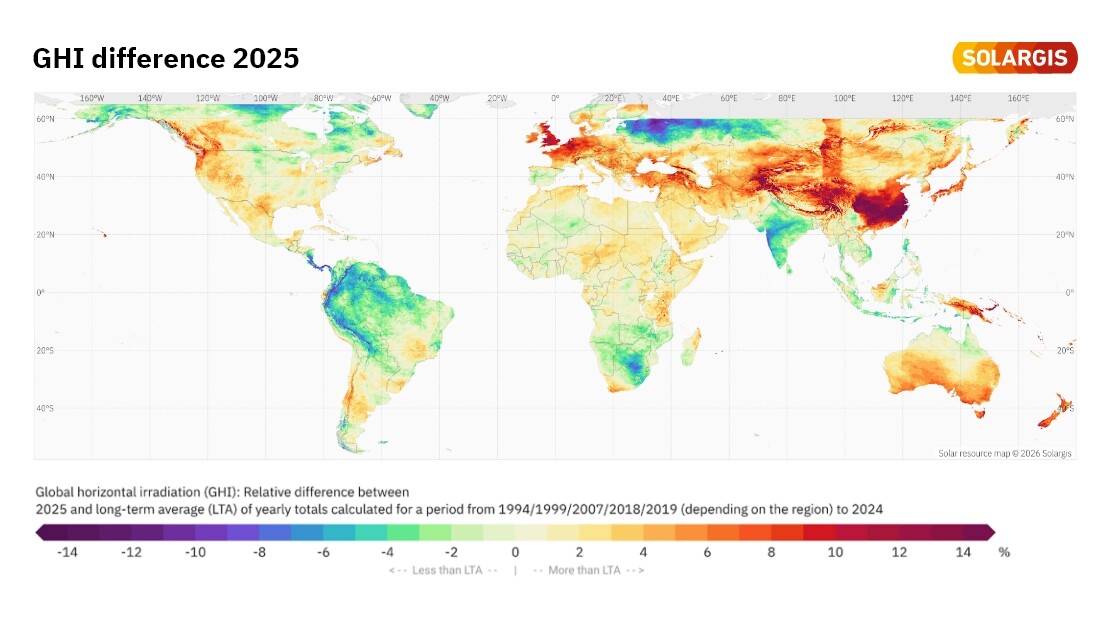
As every year, we bring you a map summarizing last year’s global horizontal irradiation (GHI) anomalies, highlighting how much regional weather conditions diverged from long-term averages (LTA). These maps help project developers, asset managers, and investors understand how atmospheric variability may have influenced PV performance worldwide.
It’s been a year since we launched Solargis Evaluate 2.0, the platform that brings high-quality solar and meteorological data, system design, and advanced PV simulation together into one solution. Today, we’d like to share some good news. From now on, every active project in Solargis Evaluate includes unlimited TMY P50 PV simulations in 15-minute temporal resolution.
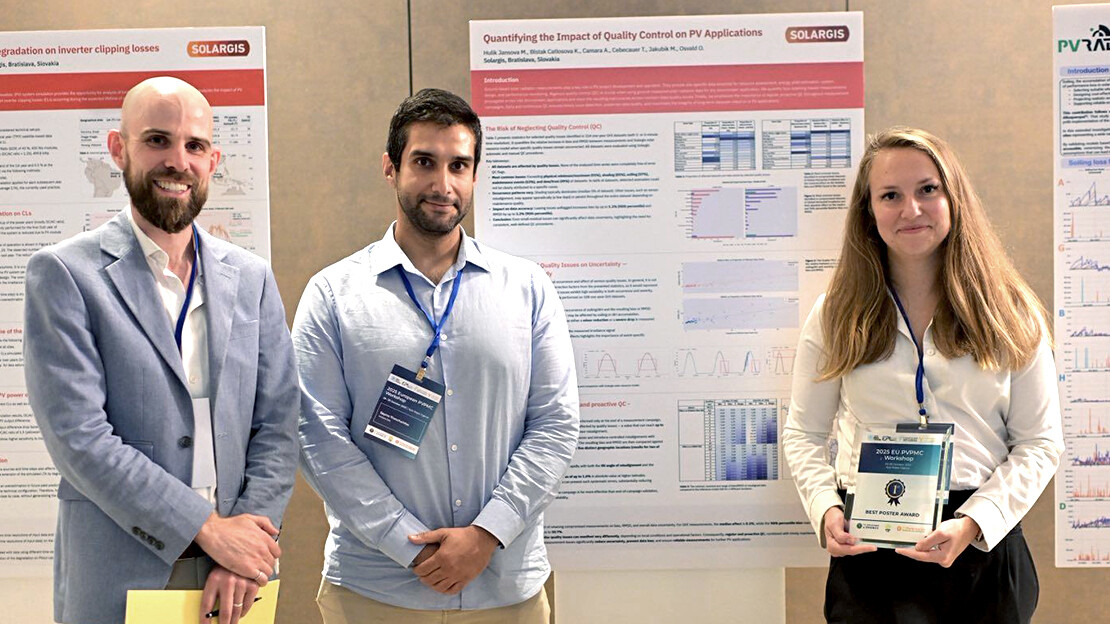
The Solargis team recently joined the Photovoltaic Performance Modeling Collaborative (PVPMC) 2025 Workshop, held on 29–30 October in Ayia Napa, Cyprus. This year’s event brought together leading experts in PV performance modeling, system analytics, and solar energy integration, with a special focus on the challenges and solutions of island grids.
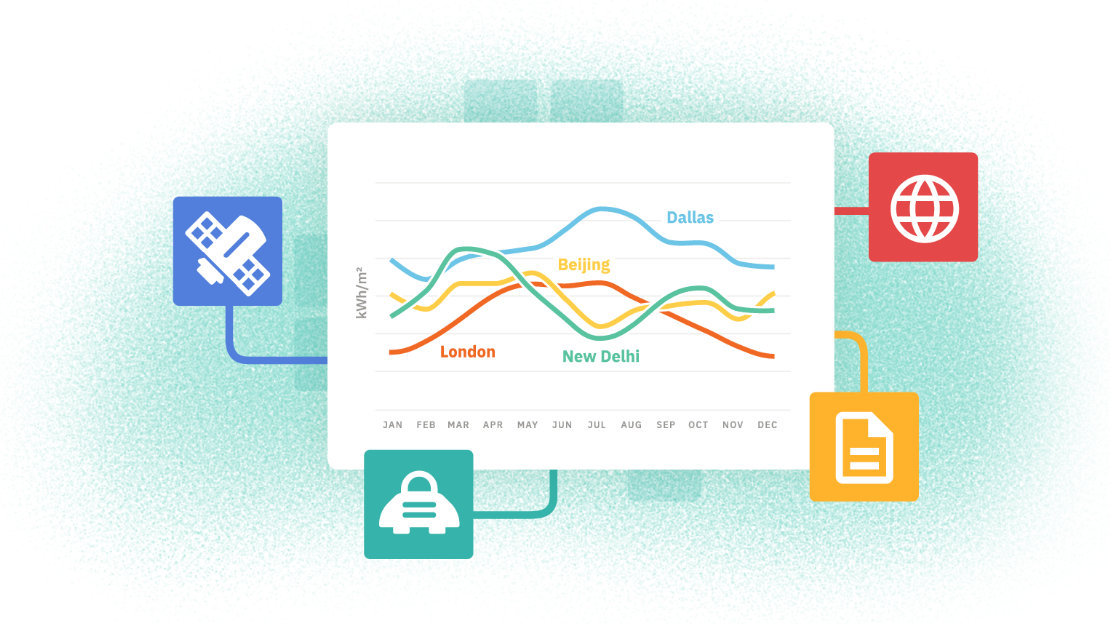
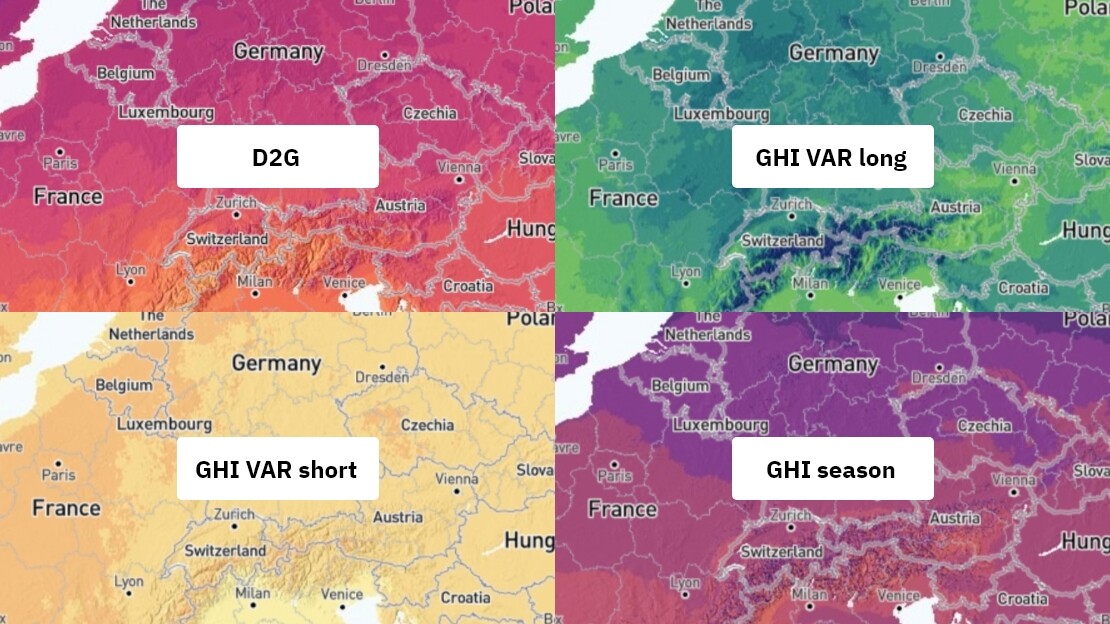
When prospecting and evaluating solar projects, most attention goes to Global Horizontal Irradiation (GHI). It is the most widely used metric for solar resource assessment and the basis of nearly every PV feasibility study. But GHI is only one of the many parts of the picture. At Solargis, we go deeper.