Pablo Caballero
Jul 17, 2025
One of the few things we can be sure of is that nothing is absolutely certain. This paradox is especially relevant in science, where uncertainty is part of every model.
In the context of PV yield simulation, uncertainty helps users understand the potential deviations in the results produced by the software they are using. Understanding these deviations plays a key role in selecting the optimal design of a power plant and in evaluating financial risks and return on investment.
Uncertainty aims to reflect the limitations and assumptions built into simulation models and their input data. One of the most important inputs when calculating PV yield uncertainty is the solar irradiance dataset used in the simulation.
In this article, I highlight key points to explain what solar irradiance uncertainty is, how it is calculated, and why understanding it is essential for reliable project assessment.
Uncertainty quantifies the range around an estimate within which the true value of a particular magnitude is expected to fall, typically expressed as a margin of expected deviation and a level of probability.
This means that when dealing with uncertainty, there are several key data points we must consider to avoid confusion and enable meaningful comparison with other values:
Summing up, a complete uncertainty statement should include:
Estimated value + solar parameter + physical unit + aggregation level + uncertainty margin + confidence level
Let’s illustrate this with an example:
Solar irradiance estimates based on semi-empirical satellite models have become a standard, thanks to the availability of consistent, high-resolution, and global satellite data.
However, the process of evaluating the accuracy of these modeled solar radiation datasets can sometimes be unclear. Let’s summarize the procedure in five key steps:
The first step of the process consists of the systematic comparison of top-class, high-quality instruments (for solar radiation, secondary standard pyranometers and first-class pyrheliometers) with model estimates at the same locations and during the same periods.
An assessment of ground measuring device quality and maintenance practices is also required. This means ensuring that pyranometers, pyrheliometers, and other sensors meet international calibration standards and are regularly recalibrated. Routine maintenance, including regular cleaning of sensor surfaces, should be also documented and strictly followed.
For each site, different indicators are calculated. They are most often known as validation statistics, since they are also used for the purpose of validating the performance of a model.
This comparison should be repeated for as many locations and over as long a period as possible. To properly evaluate a solar irradiance model, it should be carried out at meteorological stations representing all geographical regions and follow a standardized process that enables comparison across different sites and measuring stations.
It is important to highlight that validation and uncertainty are conceptually different: while validation stops at collecting a series of statistics for those sites where ground references are available, uncertainty goes one step further and aims to estimate the expected performance at sites outside the reference network.
Once a sufficient number of validation sites have been analyzed, an initial estimate of the model’s performance can be obtained. This step involves examining the frequency distribution and magnitude of deviations between model estimates and measured values.
Analyzing the bias distribution across climate zones and geographical regions helps identify the main conditions or areas where larger or smaller discrepancies are likely between modeled and ground-measured irradiance values.
These findings are often published in publicly available reports, offering preliminary guidance for solar model users on expected accuracy levels for annual values of solar radiation. However, for a more accurate uncertainty estimate at specific sites, a deeper view of all validation statistics and a complete analysis of contributing factors is required (as outlined in the next steps).
While bias quantification is essential for identifying systematic deviations between model estimates and measurements, assessing non-systematic errors is equally important. This is typically achieved by calculating the Root Mean Square Error (RMSE), which captures non-systematic deviations and offers a more comprehensive assessment of overall model performance.
Incorporating additional indicators of consistency, such as the Kolmogorov-Smirnov Index (KSI), helps evaluate a model’s ability to represent various solar irradiance conditions and offers deeper insights into model behavior before proceeding to uncertainty estimation.
Focusing exclusively on long-term (annual) validation statistics can also hide seasonal inconsistencies. Therefore, for a robust uncertainty assessment, monthly statistics should be analyzed as well.
The characteristics of the different empirical error distributions identified previously are now analyzed and compared with the characteristics of each validation site and validation period. The aim is to associate site- and period-specific properties with corresponding features of the error distribution. Key factors influencing model performance may include:
As a result, we can already identify situations where the performance of the solar model is expected to be lower, including high mountain areas, snow conditions, reflective deserts, proximity to coastlines, or urbanized environments.
Bringing together the findings from the previous step, the goal now is to estimate the level of uncertainty for the requested site. This means evaluating, for that specific site, each of the factors identified as influencing the model’s performance.
This is not an easy task and requires deep, expert knowledge of the model, its internal algorithms, and its input data. Due to the complexity of certain interactions and the limited validation experience in some regions, fully automating the uncertainty estimation process remains challenging.
The limited availability of public reference stations in certain regions also necessitates the use of more conservative uncertainty estimates. However, as new solar projects are developed, more weather stations are installed, and scientific understanding progresses, our confidence in estimating solar radiation uncertainty continues to grow.
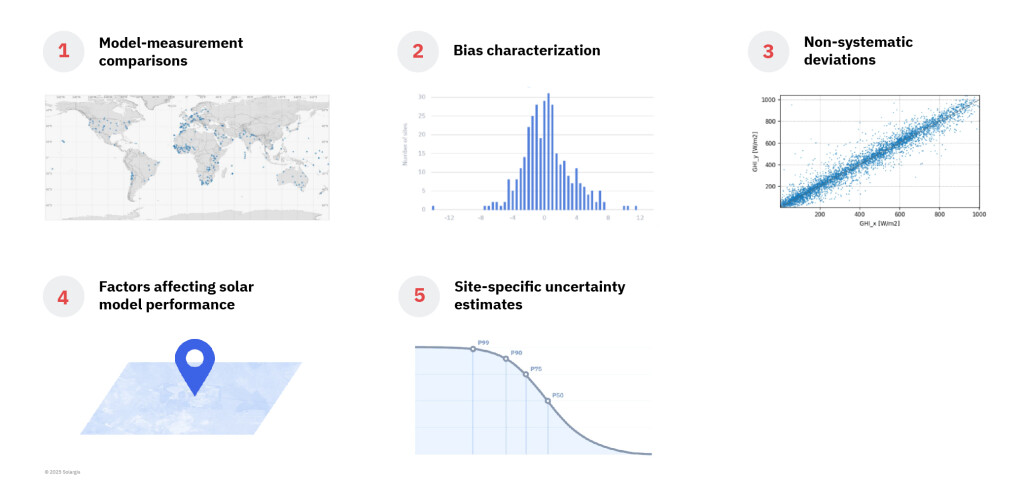
Fig.1: Steps to estimate solar irradiance model uncertainty
Comparison between models can be tricky and requires a careful review of the underlying validation processes. To help with this, here’s a checklist of key questions that can help when comparing different solar irradiance models:
As mentioned at the beginning of this article, uncertainty can never be entirely eliminated. However, this does not mean it cannot be minimized.
In the context of solar irradiance inputs, there are clear steps that can be taken to reduce uncertainty — for example, carefully reviewing input datasets and selecting the highest-quality satellite-based data provider.
Irradiance models rely on publicly available reference networks for validation, which also form the basis of uncertainty modeling (see the previous chapter). Uncertainty can be further reduced by incorporating local measurements to correct for biases introduced by the original resolution of satellite data and adjust the internal structure of the data, a process known as site-adaptation. For this, local solar irradiance measurement campaigns — lasting at least one year — are required.
That said, ground measurements are not perfect. Even the highest-quality, well-maintained GHI (Global Horizontal Irradiance) sensors carry an inherent uncertainty in the range of ±2% to ±3%. This must always be taken into account when estimating data model uncertainty.
Before any comparison or site-adaptation, measured data must undergo a rigorous quality assessment to eliminate values affected by measurement errors. These issues are typically only visible in high-resolution data — ideally sub-hourly or hourly. Aggregated data at daily or monthly resolution is unsuitable for this purpose, as proper quality screening is impossible and measurement errors cannot be reliably identified or quantified.
A useful way to show how uncertainty affects expected values for the same project is to look at the different probability distribution charts and P50 and P90 values of solar irradiance.
The following example illustrates why choosing assessments based on accuracy rather than just optimistic estimates is essential for sound project development and bankability.
Let’s consider a sample case involving two models:
|
|
Model A [kWh/m2] |
Model B [kWh/m2] |
|
Most expected value (P50) |
1250 |
1230 |
|
Value exceeded with 90% probability (P90) |
1120 |
1149 |
|
Uncertainty (P90 confidence interval) |
±10.4% |
±6.6% |
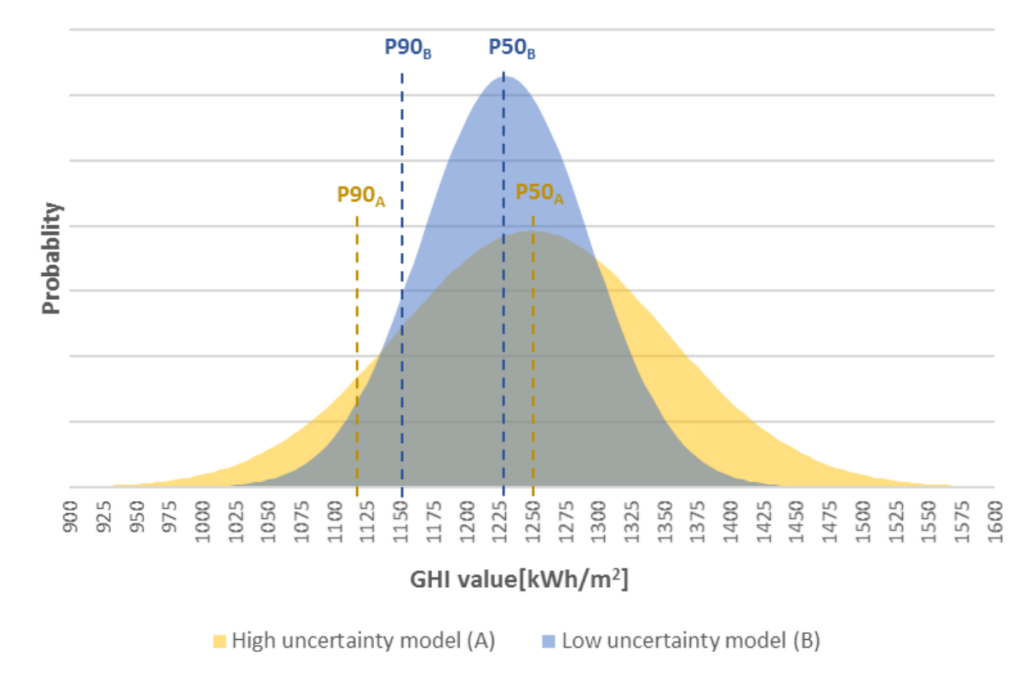
Fig.2: Uncertainty in global horizontal irradiance (GHI) estimates from two models at a sample site in Slovakia.
Although Model A may initially appear more attractive due to its higher central estimate, its broader distribution reflects increased variability and risk.
In contrast, Model B's tighter distribution results in a higher P90 irradiance, which can lead to better financial terms for project financing, especially from conservative lenders.
The solar irradiance model is not the only source of uncertainty affecting the PV yield estimate provided by the software. Throughout the PV simulation process, there are several other points where deviations may occur between the assumed values and what will happen in reality.
This means accounting for additional sources of uncertainty that must be combined to calculate annual P90, P99, or other Pxx values.
Energy simulation: While it is challenging to develop detailed uncertainty models for every step of the simulation, ongoing research continues to make progress in this area. The process involves evaluating various factors that introduce different types of uncertainty, including:
Year-to-year variability: In addition to uncertainties arising from solar irradiance and the simulation model, calculating annual P90, P99, or other Pxx values also requires accounting for interannual variability. This factor reflects natural weather fluctuations and can only be reliably estimated using a sufficiently long historical dataset.
To properly account for interannual variability, it is important to examine the reference period of the input data and how it is handled within the simulation (some software can only operate with single-year periods).
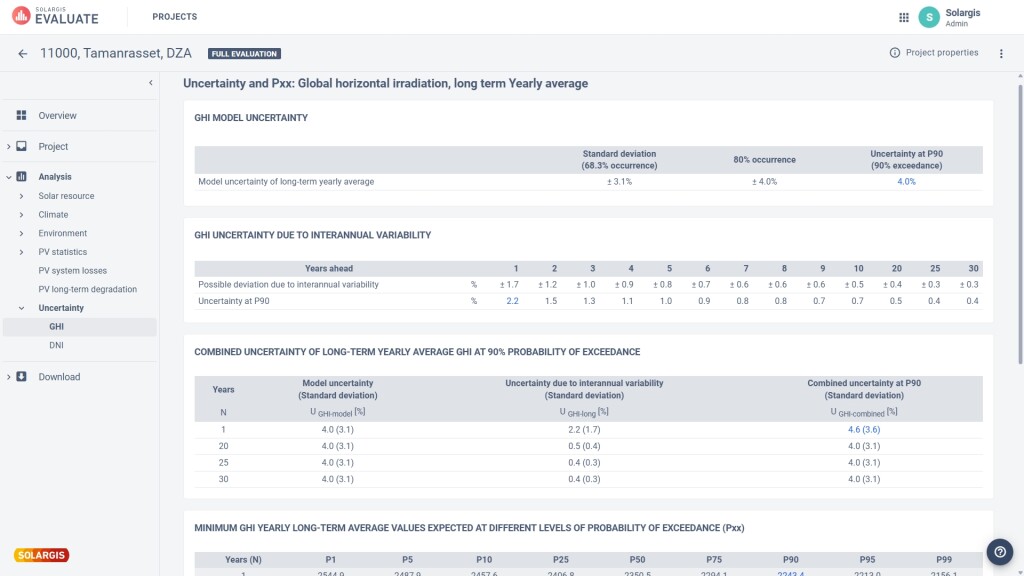
Fig.3: Screenshot of combined GHI uncertainty results in Solargis Evaluate 2.0.
Understanding PV yield uncertainty is essential for estimating financial risks. Reliable estimates of the expected solar resource are often a conditio sine qua non for securing project financing.
On the solar irradiance side, it is important for data providers not only to improve weather models and measurement techniques (i.e., to deliver more accurate data), but also to deepen their understanding of model performance, specifically by providing robust estimates of data uncertainty.
From a technical design perspective, optimizing a power plant's components without knowledge of data uncertainty is nearly impossible. Engineers must ensure that selected equipment operates within the manufacturer’s recommended conditions, and doing so requires a solid knowledge of the input data's reliability. High-quality solar irradiance inputs must be complemented by accurate and well-established computation models to minimize uncertainty in final energy yield estimates.
Although uncertainty may seem to fall somewhere between probability and expectation, a thorough and careful evaluation of it is always necessary for PV projects. Assessing uncertainty is one of the first steps toward unlocking financing and estimating realistic project returns.