Products
menu item
Prospect
Quick estimate of PV site's solar potential
menu item
Evaluate
Data, design & PV simulation in one solution
menu item
Monitor
Real-time PV output assessment
menu item
Forecast
Solar power output forecast for up to 14 days
menu item
Analyst
Simplified & unified solar data management
menu item
Integrations
Automate delivery of Solargis data
Use cases
menu item
Site selection
Find the right solar project location
menu item
Energy yield simulation
Analyze potential gains and risks
menu item
Optimizing power plant design
Find optimum power plant design
menu item
Real power plant performance
Discover the true output
menu item
Power output forecast
Predict solar project energy output
menu item
Ground data verification
Verify quality of solar & meteo measurements
Solar Resource & Meteo Assessment
Detailed solar resource validation and assessment
Site Adaptation of Solargis Models
Combining satellite data with on-site measurements
Quality Control of Solar & Meteo Measurements
Correction of errors in ground-measured data
Customized GIS Data
Customized Solargis GIS data for your applications
PV Energy Yield Assessment
Estimated energy uncertainties and related data inputs
PV Performance Assessment
Energy estimate for refinancing or asset acquisition
PV Variability & Storage Optimization Study
Understand output variability across wide geo regions
Regional Solar Energy Potential Study
Identification of locations for solar power plants
Our expertise
How our technology works
Methodology
How we transform science into technology
Knowledge base
Release notes
Success stories
Blog
Ebooks & Whitepapers
Webinars
Collaterals
Publications
Events
Free Maps & GIS Data
Solar performance maps
About Solargis
Partners
ISO Certification
Careers

New generation Solargis Evaluate: data, PV design & simulation, analysis, and reports in one cloud-based solution. Discover more ->

We’re introducing eight new map layers in Solargis Prospect, designed to provide quick insights into factors affecting the performance, durability, and risk profile of photovoltaic (PV) systems.

These new layers offer essential data for PV project engineers, developers, and financial planners, helping them make informed decisions about site selection, system design, and long-term investment strategies.

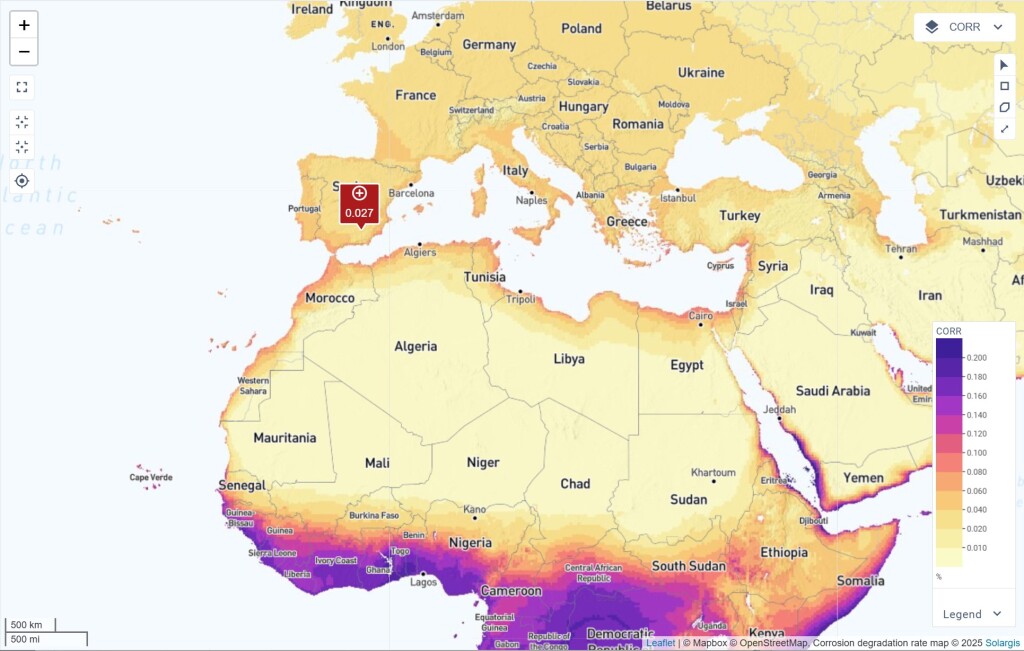
The latest update brings eight new map layers to the Solargis Prospect platform:

1. Long-term solar resource variability (GHI VAR long)

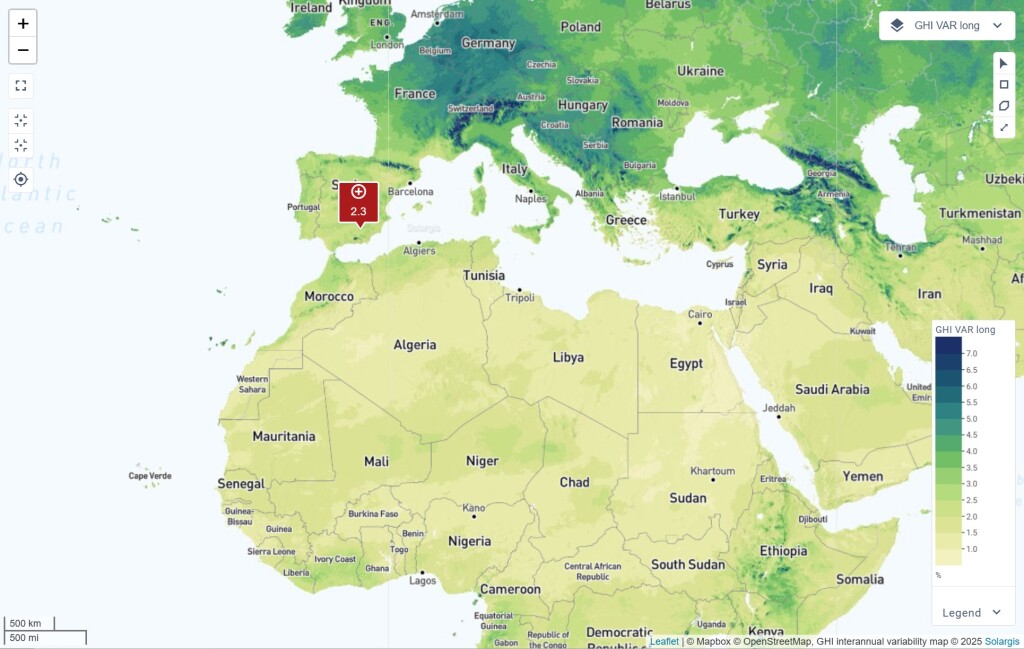
Solargis Prospect now includes a global map and data detailing interannual solar resource variability, helping you assess year-over-year fluctuations in solar irradiation. By understanding these long-term trends, you can evaluate financial risks and planning stability and compare solar resource stability across different locations or regions.

GHI VAR long

2. Short-term solar resource variability (GHI VAR short)

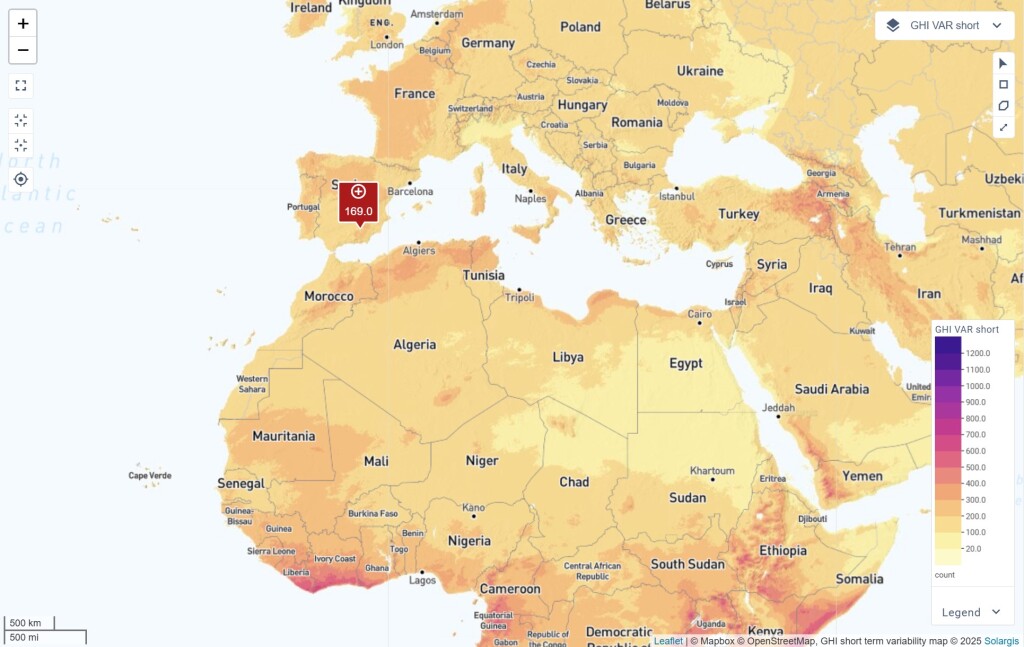
Solar resource intermittency—caused by forming and moving clouds—is a challenge for PV plant operations and grid balancing. This map layer shows daily fluctuations in solar irradiation, enabling better system design, energy storage planning, and grid integration.

GHI VAR short

3. Highest expected operating temperature (THEO)

Extreme heat negatively impacts PV efficiency, lifespan, and reliability of PV systems. This map layer helps assess temperature tolerance limits, allowing you to identify potential risks and implement appropriate mitigation measures to protect PV systems.

THEO

4. & 5. Ultraviolet radiation A & B (UVA & UVB)

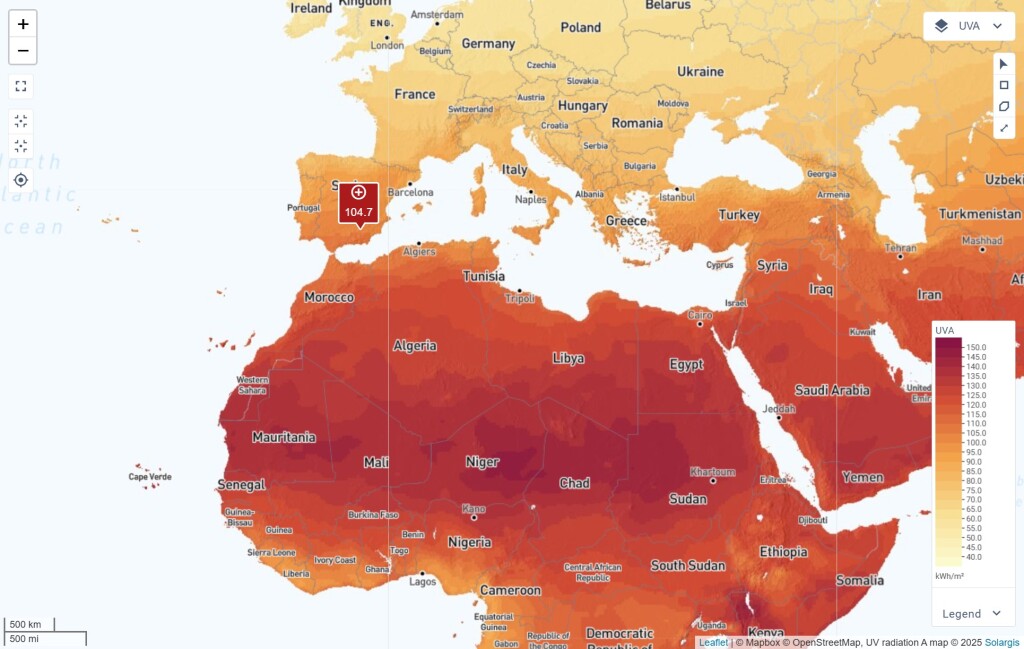
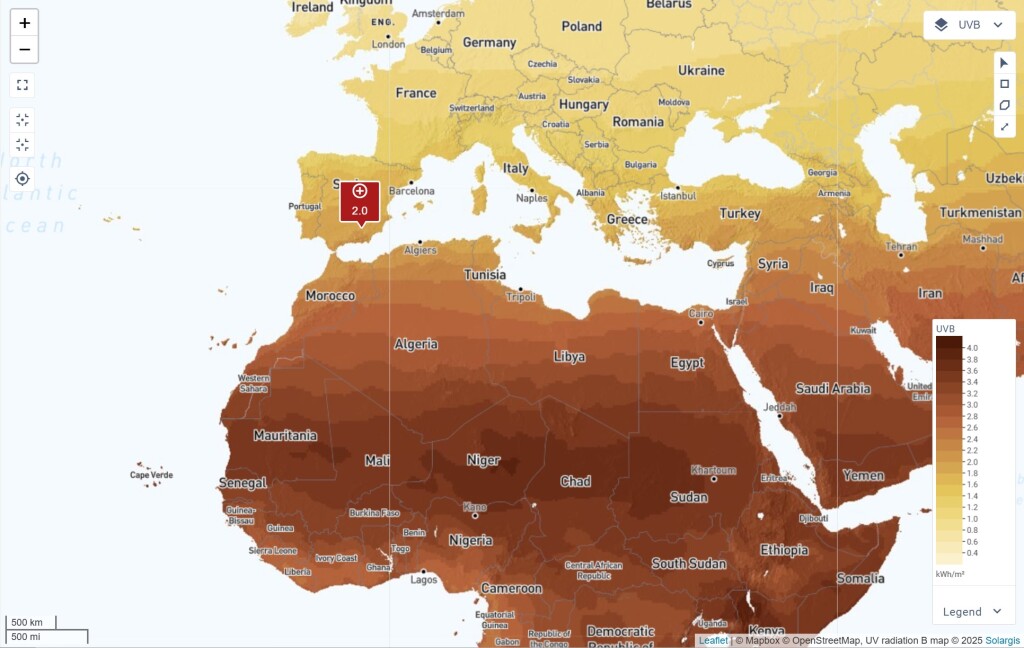
UV radiation accelerates material degradation, causing cracking, discoloration, and reduced performance in PV modules. The UVA and UVB maps allow users to compare UV exposure across different locations, assess failure risks, and select components with higher UV resistance for improved durability.

UVA

UVB

6. Daily module temperature amplitude higher than 50 degrees Celsius (TMOD AMP50)

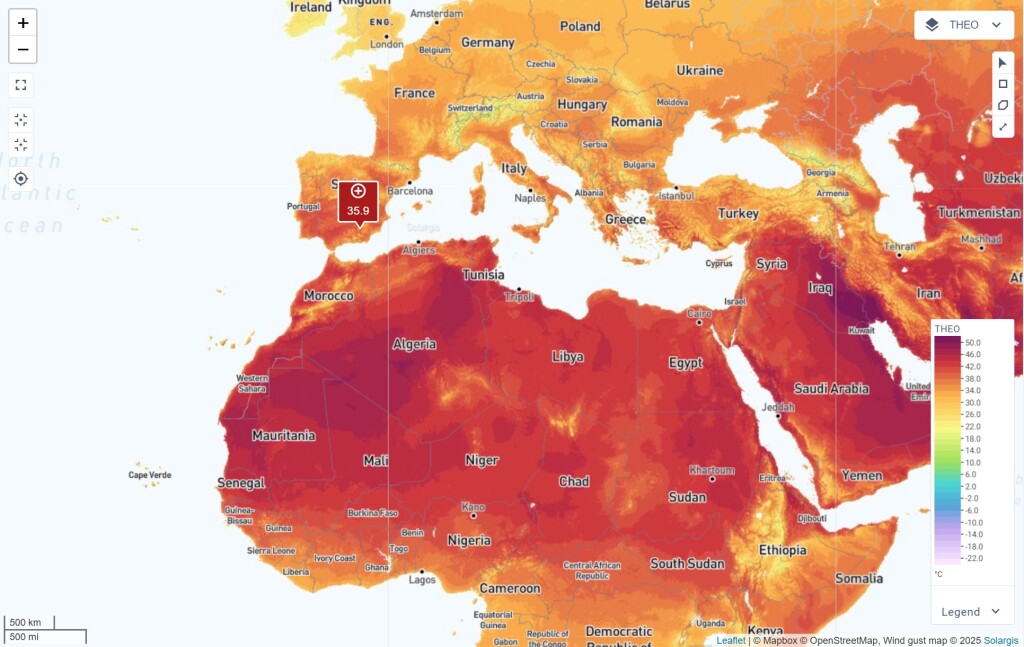
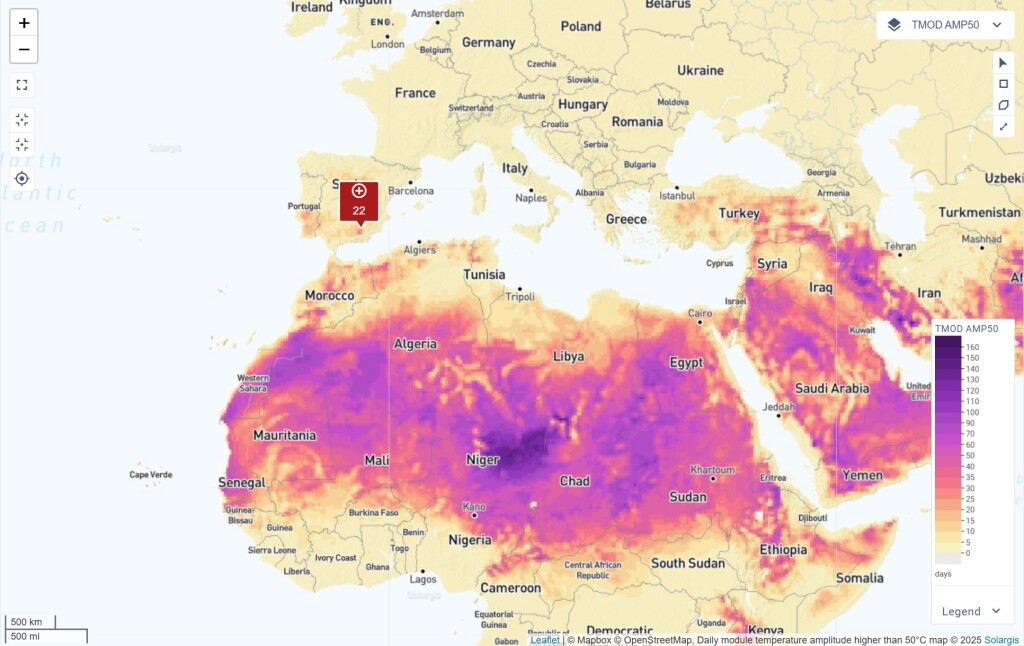
Thermal cycling is a major cause of PV module degradation. This map helps users assess the frequency of extreme temperature fluctuations at a project site, enabling better risk assessment and mitigation planning. It also facilitates regional comparisons to optimize PV system placement.

TMOD amp50

7. Wind gust p99 (WG P99)

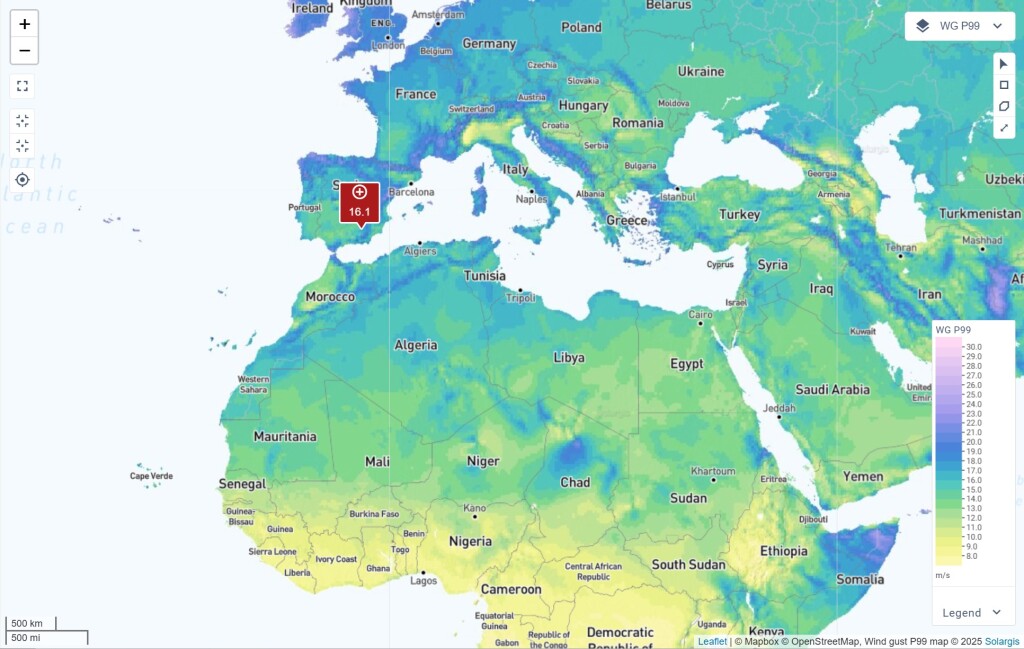
Wind gusts affect PV module stability, tracking systems, and overall energy output. This layer provides data on extreme wind conditions, helping optimize module design, tracker selection, and structural safety to reduce energy losses and prevent damage.

WG p99

8. Corrosion degradation rate (CORR)

High temperatures and humidity accelerate corrosion, impacting PV module performance and longevity. It also weakens the electrical connections, increases leakage currents, and reduces power output over time. This map layer helps users assess corrosion risks in different environments, aiding in module selection, maintenance planning, and project siting.

CORR

Find more details about the new map layers in Solargis Knowledge Base.

Keep reading

From Time Series to TMY: When to use each?
Best practices

From Time Series to TMY: When to use each?

All Solar industry players need to simulate their power plant designs and financial plans at some point. To do so against summarized conditions given by data products like Typical Meteorological Years has been common until recently. However, running energy simulations using more realistic conditions described by Multi-Year Time Series of data is recommended to reduce project risk and evaluate all scenarios.

Solar irradiation difference map of 2024: Another year of extremes
Solargis news

Solar irradiation difference map of 2024: Another year of extremes

At Solargis, we conducted our yearly analysis of global horizontal irradiation (GHI) and evaluated the difference for 2024 from the long-term average (LTA).

Introducing Solargis Evaluate 2.0: A new standard for PV project design and evaluation
Solargis news

Introducing Solargis Evaluate 2.0: A new standard for PV project design and evaluation

Today, we launched Solargis Evaluate 2.0, the next generation of our Evaluate solution. The new Evaluate is a more advanced, cloud-based platform for complete PV project design and evaluation, equipping project developers and industry experts with all the tools needed to tackle the growing complexity of modern solar projects.