Esta página aún no está traducida al español. Puede verla sólo en inglés.

Juraj Beták
Aug 12, 2025
This summer, Japan is experiencing a record-breaking heat wave. For the third year in a row, the country has set a new high for average July temperatures — with July 2025 ending 2.89 °C above the 1991–2020 average.
Alongside the extreme heat, solar resource levels also reached unprecedented highs in several other regions, including South Korea, and eastern China, marking July 2025 as exceptional both for its temperatures and its PV generation potential.
Using our proprietary Solargis data, we track and analyse unusual patterns in solar resource availability each month, with coverage spanning the entire globe.
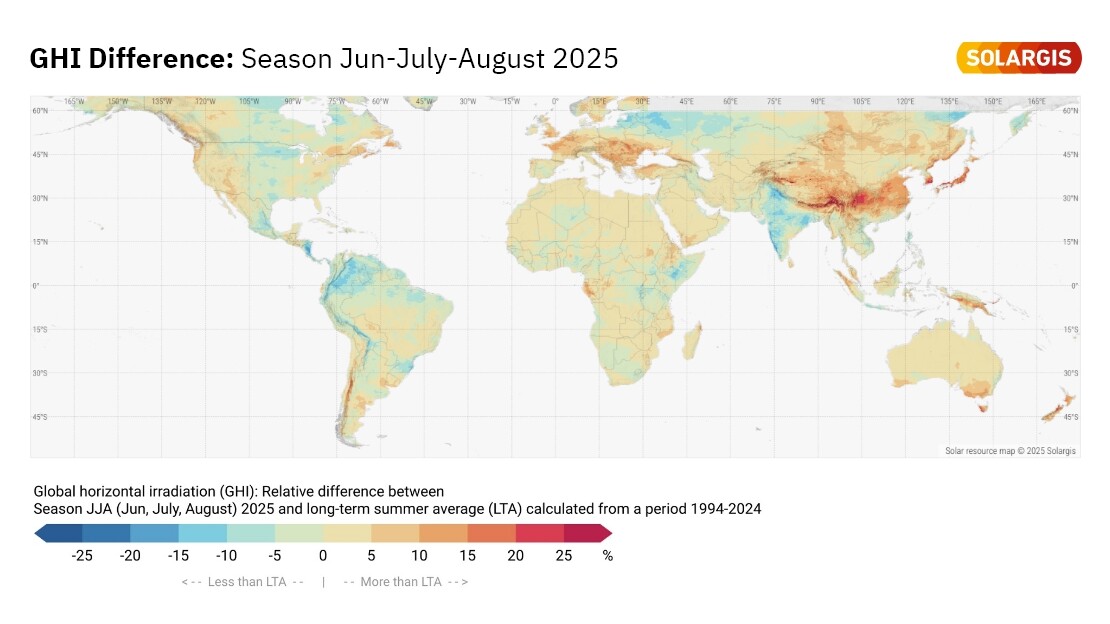
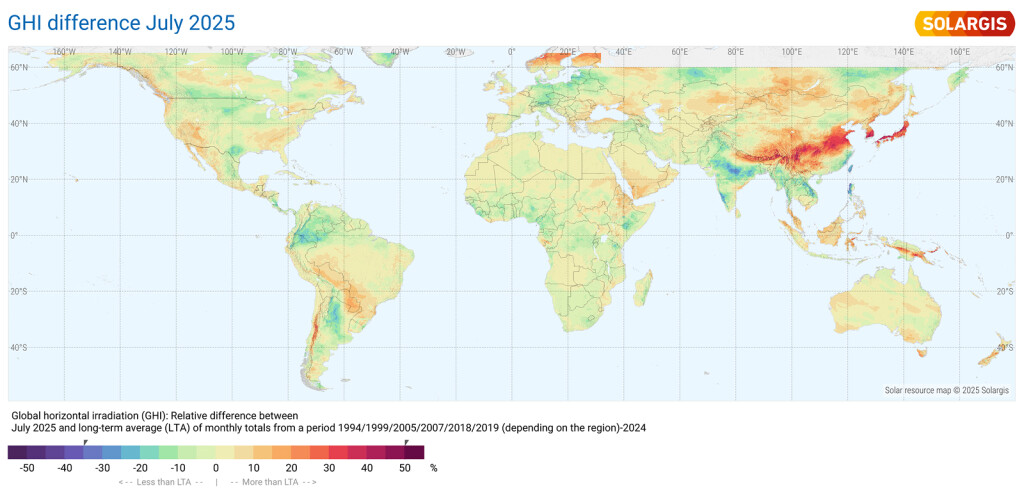
Looking at GHI (Global Horizontal Irradiation) for July 2025, most of the world saw solar resource within a fairly normal range — about −15% to +15% compared to the long-term average (LTA).
The most notable exception was East Asia: Japan, South Korea, and eastern China. In these countries, we observe some of the strongest positive anomalies (regionally over +40%), while Taiwan and the northern Philippines experienced notable deficits (below -35%).
Alongside the record-breaking air temperatures observed in many parts of Japan, solar resource also reached unprecedented levels. Within Japan, the picture was not uniform:
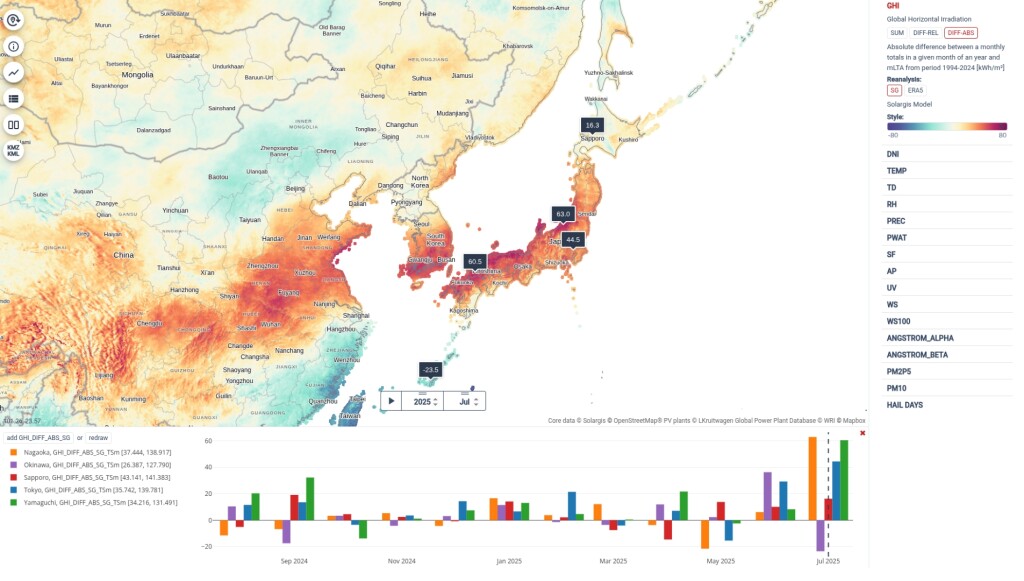
The map above illustrates the July 2025 GHI difference from the long-term average, shown in absolute values [kWh/m2] .
The accompanying chart tracks monthly GHI anomalies over the past 12 months for five selected locations. It’s clear that the latest month stands out — with locations on Honshu and Kyushu recording the most pronounced deviations in the entire year, and eventually in the history of Solargis database, going back to 2007.
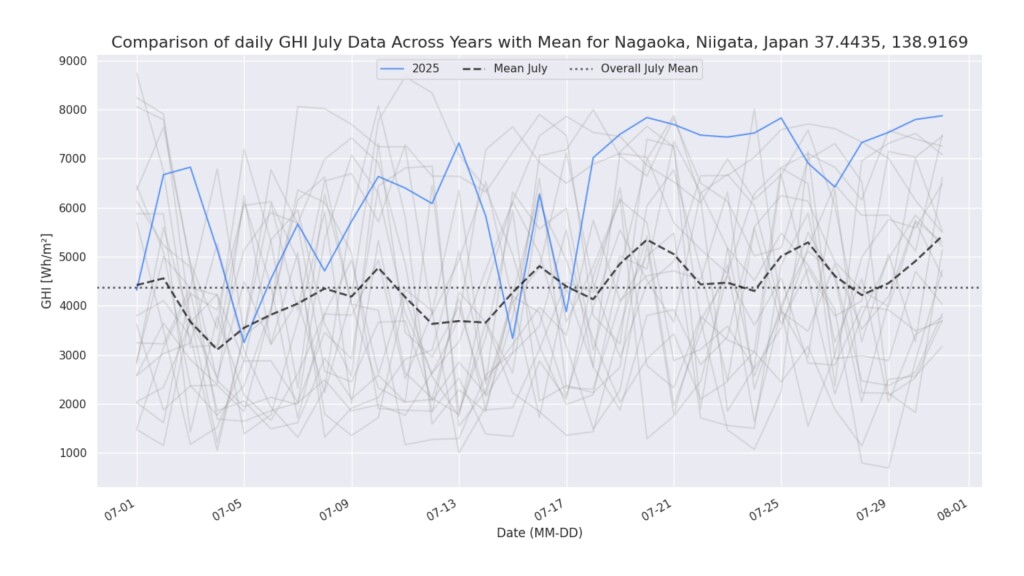
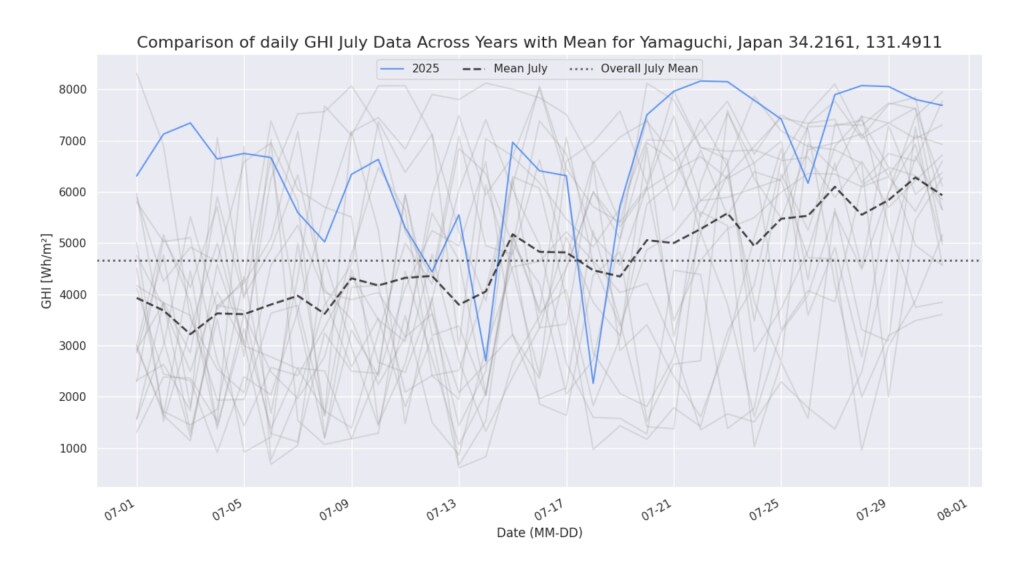
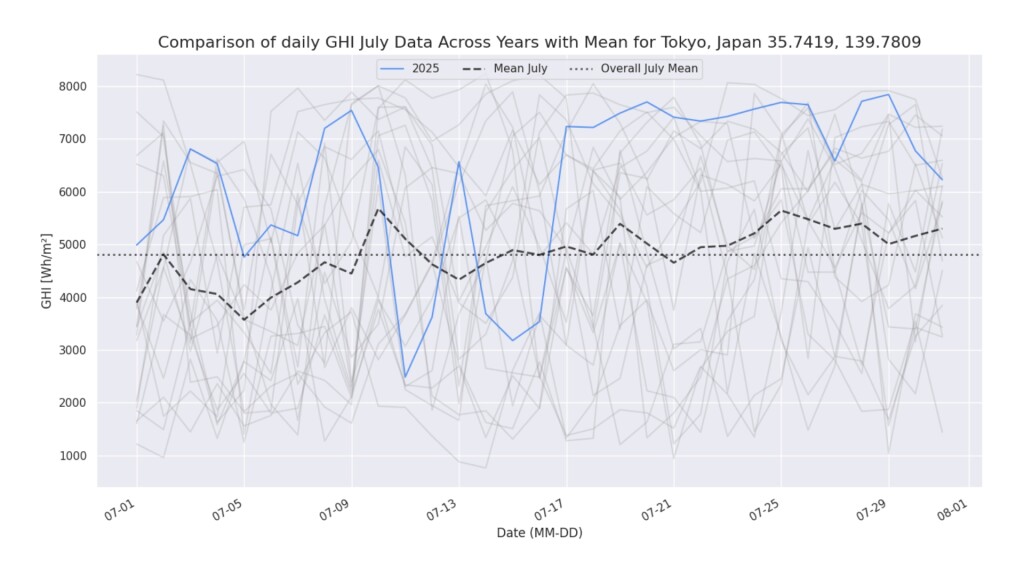
For three locations on Honshu island, the charts below show daily totals of GHI for days in July for the period 2007-2025.
We see that days in the beginning of the month were oscillating up and down around the average. But in the 2nd half of July 2025 (specifically from 18th July onwards) clear-sky days, leading to overall monthly positive anomaly in GHI.
Mine City PV power plant is located in in Yamaguchi Prefecture with a grid-connected output of 50 MW and solar panel output of approximately 56.34 MW.
In July 2025, the area where the PV plant is located received +42.2% more solar irradiation than the average July, based on the recent 18-year reference period (2007–2024). The bar chart below the map shows the month-by-month GHI differences since 2007. It confirms that this was the highest recorded anomaly in the dataset’s history.
Since solar resource is the primary driver of PV electricity generation, this exceptional month could have boosted the plant’s July performance by an estimated 30–40% above the long-term average.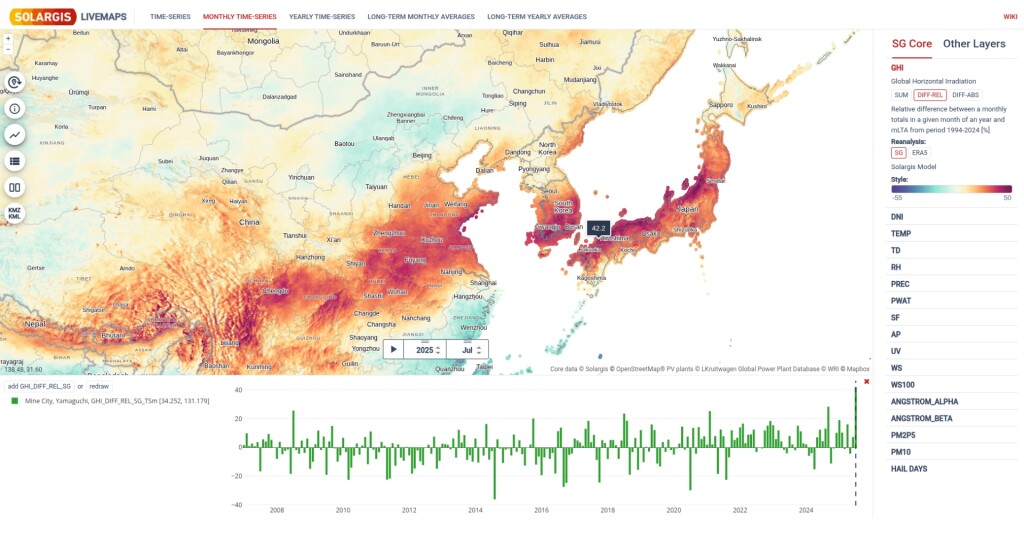
History shows the opposite can also happen. In July 2020, much of Japan saw solar resource plunge well below the long-term average. At that time, the newly launched Mine City PV power plant received −30% less solar irradiation than usual — a shortfall that inevitably impacted its electricity generation.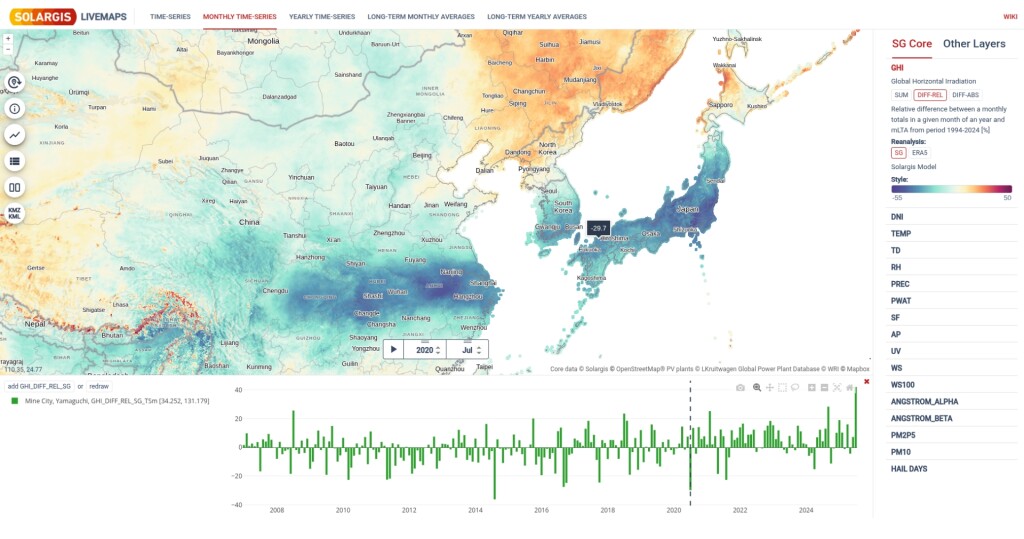
This is why Solargis monthly performance reports are valuable: they help prevent frustration when production falls short, and keep expectations realistic when output exceeds the norm. At Solargis, we know that high-quality, long-term data is the foundation for accurate performance assessment of PV projects.