Esta página aún no está traducida al español. Puede verla sólo en inglés.

Giridaran Srinivasan
Aug 3, 2025
The recent heat dome that enveloped large parts of the Midwest, Northeast and Southeast of the U.S., including states like North Carolina and Maine, has exposed vulnerabilities in the operational and trading strategies of utility-scale solar projects.
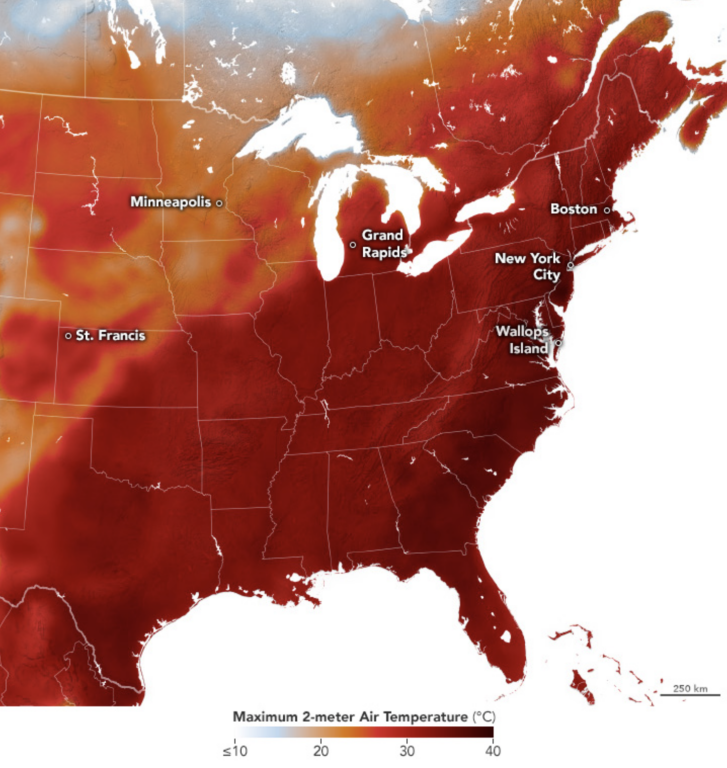
Heatmap showing maximum 2-meter air temperature on the East Coast of the US. Source: Earth Observatory NASA
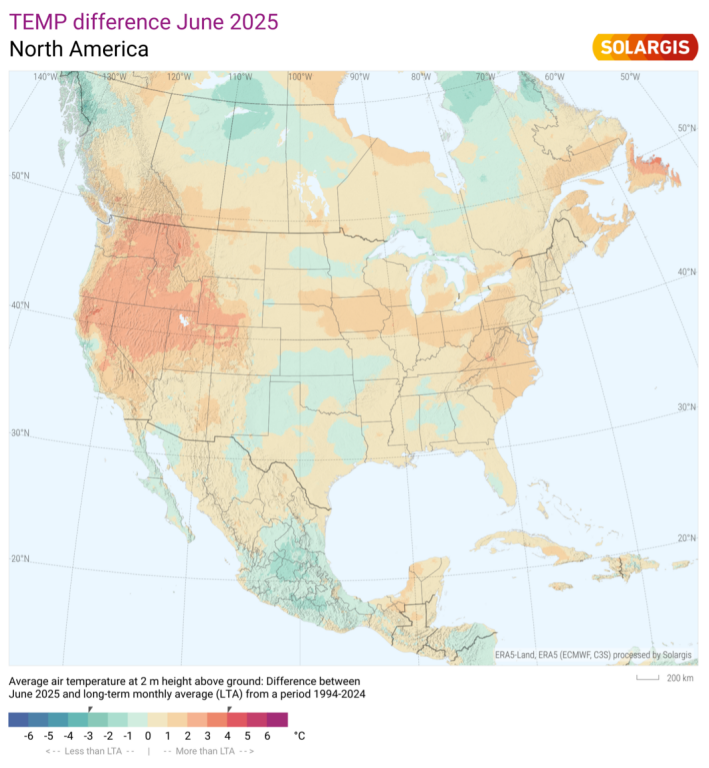
Map showing temperature difference in North America in June 2025. Source: Solargis
These extreme weather conditions had direct operational consequences. During the peak heatwave, operators in north-eastern markets such as NYISO, PJM, IESO and ISO-NE were the most heavily impacted. These regions have seen a rapid influx of new solar power projects, alongside growing electricity demand driven by AI-powered infrastructure development. This trend is particularly evident in Northern Virginia, home to the world’s largest concentration of data centers, which handle majority of global internet traffic daily.
However, what compounded the strain on these grids was the limited availability of battery storage. In contrast to storage-rich regions like Texas (ERCOT) and California (CAISO), much of the Northeast lacks sufficient battery energy storage (BESS) capacity to buffer sharp generation-demand imbalances during stress events.
The role of BESS in grid stability was clearly demonstrated in Texas, which also faced extreme temperatures on June 24.
During the heat dome, ERCOT’s expanded battery storage fleet – now totaling nearly 7.5GW of additional capacity – played a decisive role in keeping the grid stable. According to the 2025 Federal Summer Reliability Assessment, ERCOT’s risk of issuing a summer evening Energy Emergency Alert declined from 15% in 2024 to just 3% this year. Meanwhile, average evening battery discharges in preceding months grew from ~238MW to ~714MW, with peaks exceeding 4GW – allowing the grid to absorb generation shortfalls and avoid emergency actions.
Yet even in high irradiance conditions, solar output was not immune to disruption. Elevated ambient temperatures in areas led to module temperature derating, reducing actual energy output. This effect can be even more pronounced in older power plants with outdated inverter technology.
On 24 June, real-time prices in ISOs like NYISO and MISO surged above $2,000/MWh, while Day-Ahead prices remained below $500/MWh.
This stark divergence in pricing meant that even minor forecast deviations could result in significant financial losses—particularly where Day-Ahead forecasts overestimated production and also if plants underperformed due to heat-related derating. Older plants could especially be vulnerable, with operators forced to settle production shortfalls at peak real-time prices.
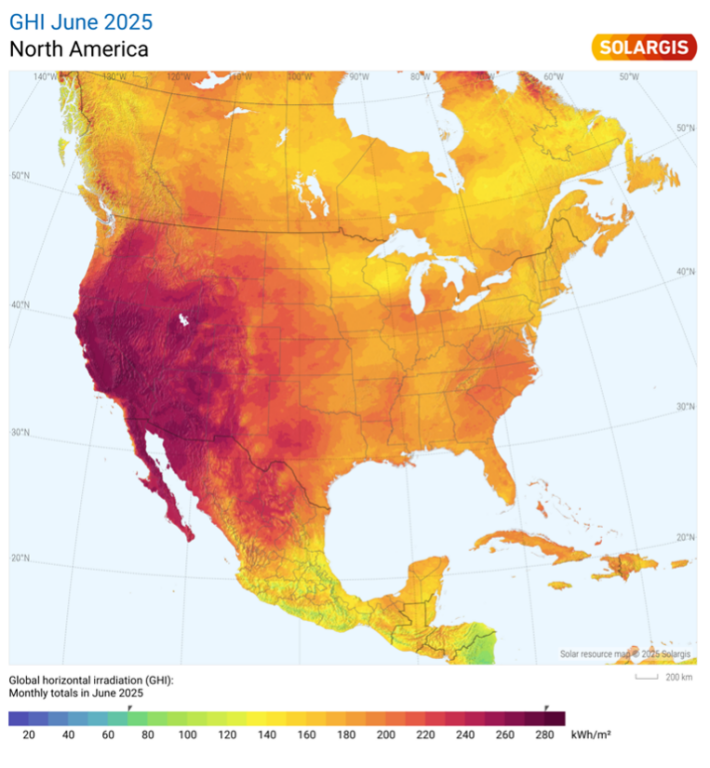
June global horizontal irradiation USA – showing potential of 280 kWh/m2 Source: Solargis
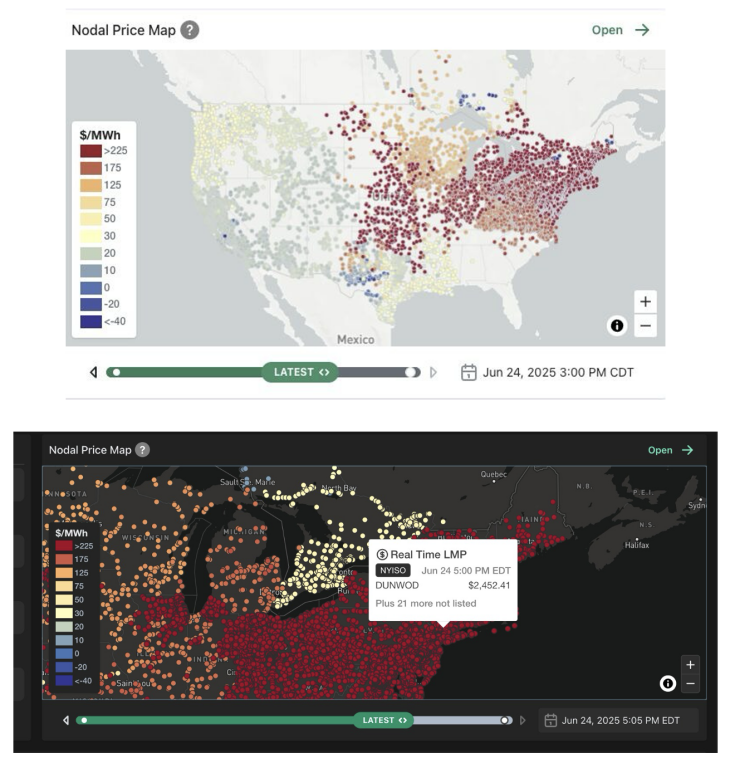
Nodal Price Maps show varying price ranges across the U.S. Source: Gridstatus
Such volatility has serious implications for merchant solar assets. U.S. projects that are no longer supported by long-term power purchase agreements (PPAs), or are exiting Capacity Markets, now face far greater exposure to real-time price fluctuations. As more projects adopt merchant or quasi-merchant positions, the margin for forecasting error continues to shrink.
To manage this exposure, long-term weather and price datasets are proving essential. Time Series data - spanning decades rather than relying on a single “typical year” - allow asset owners and operators to better anticipate generation and pricing anomalies during high-risk periods like heatwaves.
Traditional Day-Ahead generation forecast data based on basic solar irradiance and meteorological data are no longer sufficient on their own. What’s needed is a more integrated view that accounts for not just solar resource variability, but also ambient temperature fluctuations, aging asset performance, and the historical patterns of market price volatility.
Beyond proactive forecasting, this kind of data also enables accurate post-event diagnostics - helping determine whether performance deviations were weather-related, technical, or operational in nature.
At Solargis, we’re working closely with traders and asset operators to improve the forecasting inputs used for day-ahead and real-time market participation. This also includes refining how they evaluate project design in the first place by helping them factor in temperature anomalies and historical patterns of extreme weather at specific sites. Our enhanced models integrate real-world generation data and apply volatility-weighted adjustments, providing a more accurate forecasted generation in uncertain conditions.
These insights are increasingly being used not just to optimize bids, but also to inform broader asset management strategies, particularly for older or underperforming plants.
The heat dome has also ignited questions around the future management of aging solar assets. As modules degrade and temperature sensitivities increase, operators must reassess both original design assumptions and real-time operational capabilities. Without accurate visibility into thermal losses and inverter behaviour under heat stress, even established assets risk underperformance during high revenue periods.
Heat dome conditions highlight how a reliance on conventional forecasting models, which often fail to fully capture the impact of extreme weather variability on solar performance, leaves operators exposed to high levels of financial risk. In high-temperature conditions, older assets with narrower MPPT voltage ranges are particularly vulnerable to output degradation, which is an operational reality that must now be factored into forward-looking forecasts.
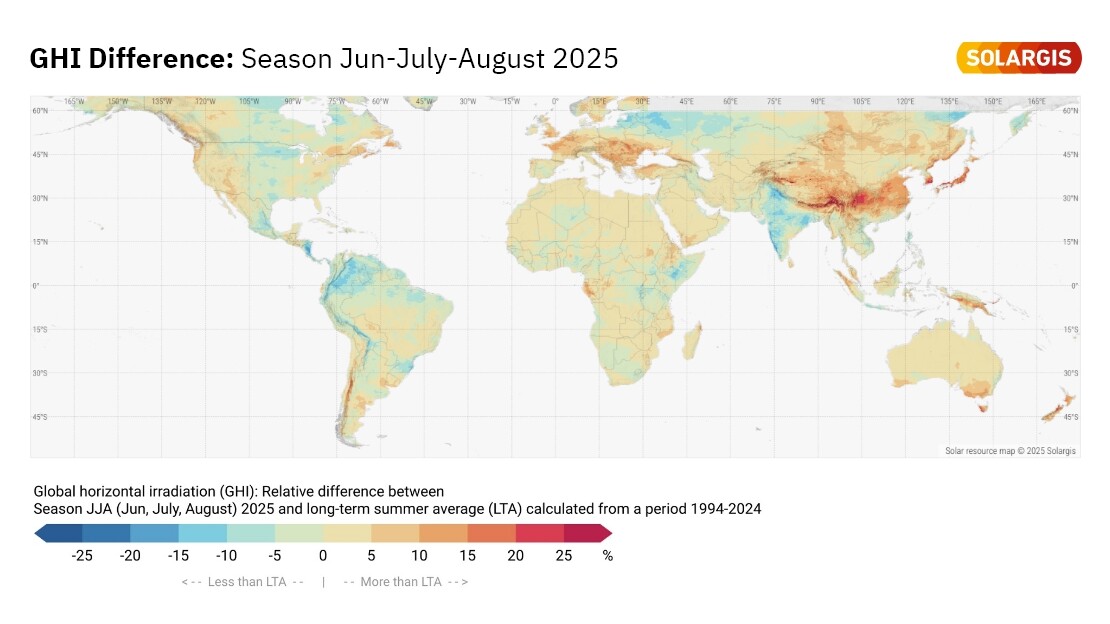
The June U.S. heatwave also echoes trends seen elsewhere. It follows one of Western Europe’s sunniest springs on record, with solar irradiance significantly above long-term norms. Solargis data showed that some regions recorded up to 50% more Global Horizontal Irradiation (GHI) compared to 30-year averages - creating favorable conditions for energy yield but also reinforcing the need for more precise forecasting and project evaluation tools.