
Participe no nosso próximo webinar «É possível confiar nos dados medidos?», a realizar-se no dia 27 de outubro de 2026, às 10h00 CET. Inscreva-se aqui

Juraj Beták
Sep 21, 2026
A época de junho-julho-agosto de 2026 registou vários extremos regionais notáveis em termos de irradiação solar, temperatura e precipitação.
Enquanto algumas regiões registaram condições excepcionalmente quentes e ensolaradas, outras registaram défices significativos de irradiação, impulsionados por nebulosidade persistente, atividade intensificada da monção ou padrões de chuva invulgares. Ao mesmo tempo, ondas de calor, incêndios florestais e sinais climáticos mais amplos, como a evolução das condições do ENOS (El Niño–Oscilação Sul), acrescentaram ainda mais complexidade à análise do desempenho fotovoltaico.
Estes contrastes são claramente visíveis nos mapas de diferenças da Solargis, que comparam a época agregada de junho-julho-agosto (JJA) de 2026 com as médias de longo prazo (LTA).
Vamos analisar mais de perto os mapas, ver onde esta época se desviou das condições normais e explorar por que razão estes desvios são importantes para o desempenho, a elaboração de relatórios e o planeamento dos ativos fotovoltaicos.
A estação JJA (junho–julho–agosto) de 2026 foi marcada por uma forte variabilidade regional. Algumas regiões registaram condições excepcionalmente ensolaradas, incluindo partes da Europa Ocidental, do centro-oeste da Índia, do leste da Indonésia, da China Central e de determinadas áreas do Pacífico Ocidental.
Ao mesmo tempo, outras regiões registaram uma irradiação substancialmente reduzida, incluindo a Escandinávia, o norte da Grã-Bretanha, o centro dos EUA, o sul do Japão, o leste da Índia, partes da América do Sul e várias áreas afetadas pela monção.
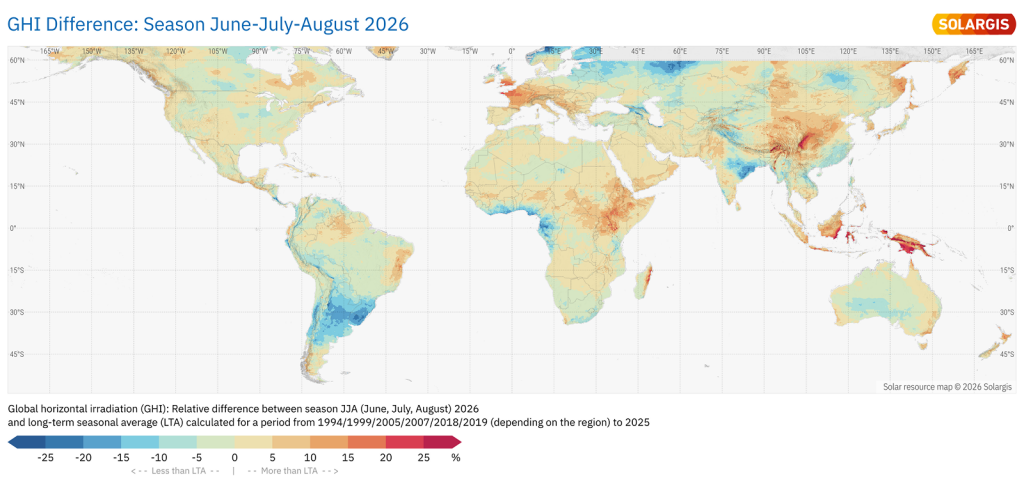
Diferença na irradiação horizontal global entre a estação JJA de 2026 e as médias sazonais de longo prazo.
Estes contrastes estiveram intimamente ligados a padrões meteorológicos mais amplos: ondas de calor e condições de seca na Europa Ocidental, intensa atividade das monções em partes do Sul da Ásia, défices de precipitação noutras regiões da Índia e condições do ENOS em evolução que afetaram o Pacífico e as regiões adjacentes.
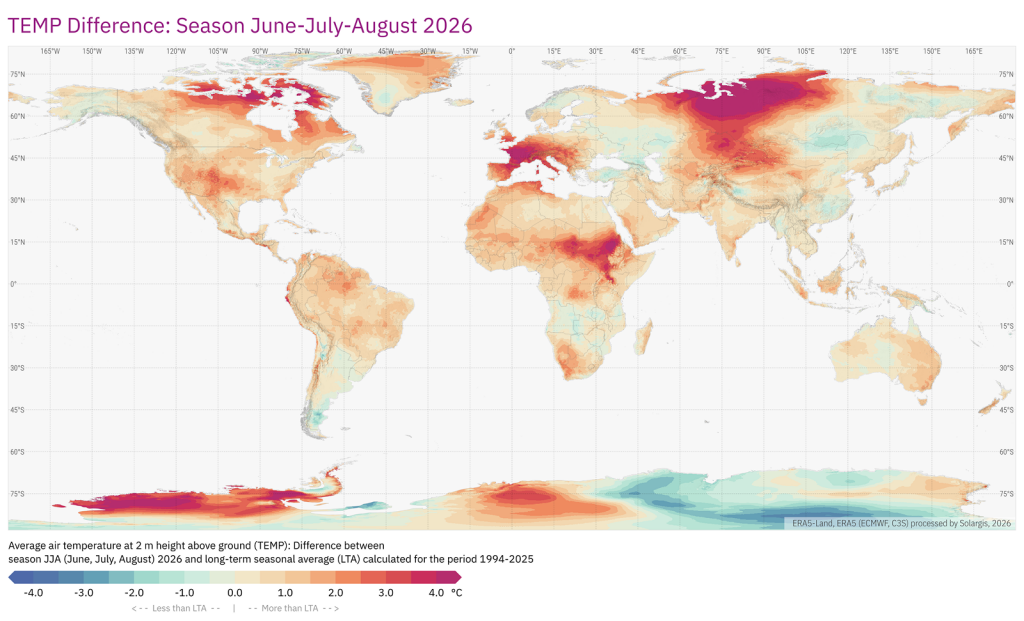
Temperatura do ar a 2 m de altura acima do solo para a estação JJA de 2026, comparada com as médias sazonais de longo prazo.
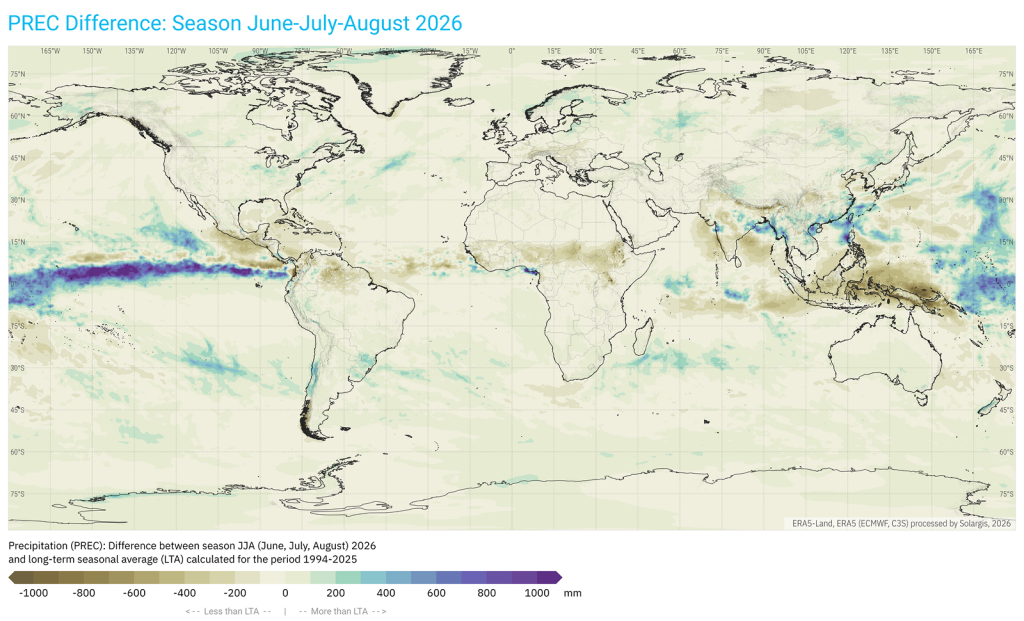
Diferença de precipitação entre a estação JJA de 2026 e a média sazonal de longo prazo.
Grande parte da Europa, particularmente as suas regiões centrais e ocidentais, registou um dos verões mais quentes e secos de que há registo, acompanhado por um GHI acima da média.
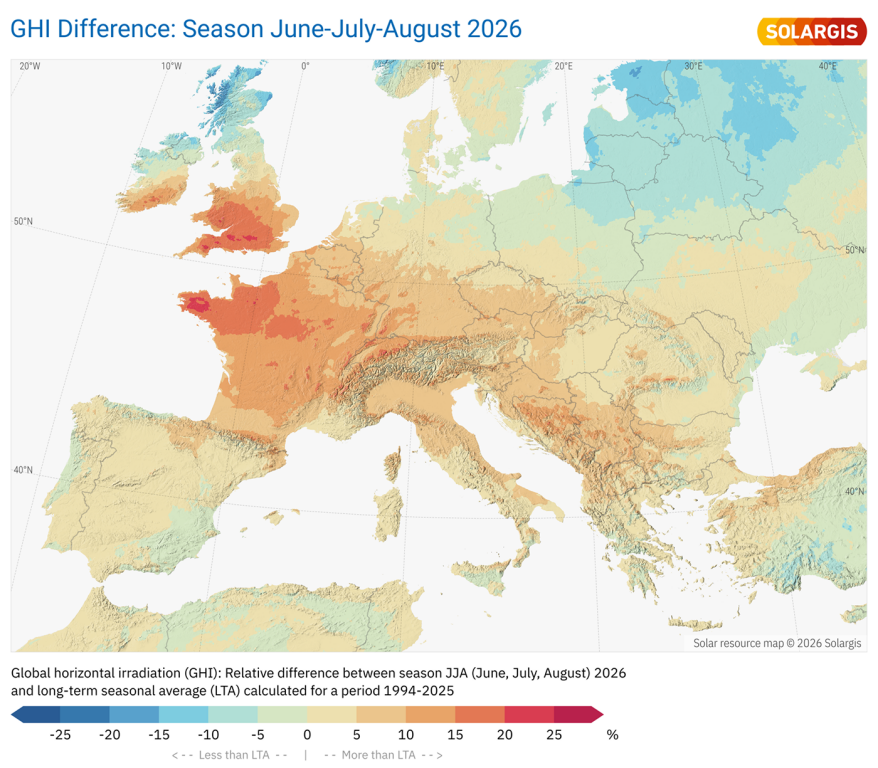
Diferença na irradiação horizontal global entre a estação JJA de 2026 e as médias sazonais de longo prazo no continente europeu.
O sul de Inglaterra, o País de Gales e a Normandia registaram anomalias de GHI superiores a +20%. A maior parte da Europa Central e dos Balcãs também registou valores de GHI acima da média, variando geralmente entre +5% e +15%.
As anomalias da temperatura média sazonal do ar variaram tipicamente entre +2 °C e +4 °C, atingindo aproximadamente +4,5 °C em algumas partes da França Central. Em combinação com condições de seca prolongada, isto contribuiu para uma intensa atividade de incêndios florestais em julho, quando mais de 70 000 hectares arderam em França, marcando a maior época de incêndios florestais do país desde 1949.
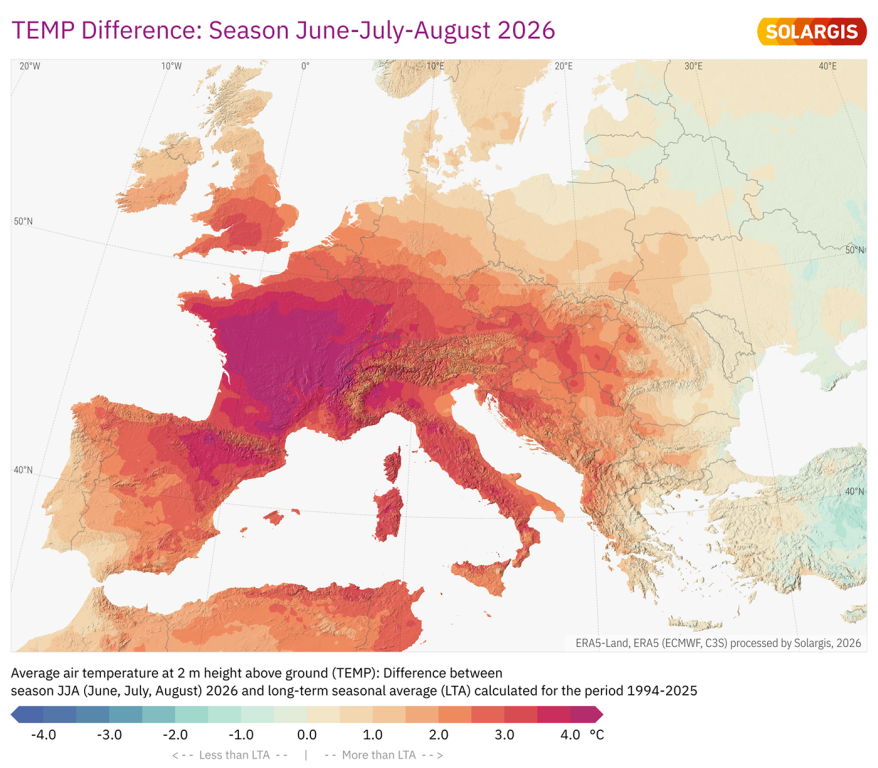
Temperaturas do ar a 2 m de altura acima do solo para a estação JJA 2026, comparadas com as médias sazonais de longo prazo na Europa.
Os défices de precipitação foram generalizados na Europa Ocidental e Central. Muitas regiões registaram uma precipitação sazonal 50 % abaixo do normal, com défices locais a atingirem até −80 %.
Na Europa Central, a falta persistente de chuva agravou as condições já secas do solo e da vegetação. Juntamente com temperaturas acima da média e elevada irradiação solar, esta secura intensificou o stress térmico e contribuiu para um risco elevado de incêndios florestais em todas as regiões afetadas.
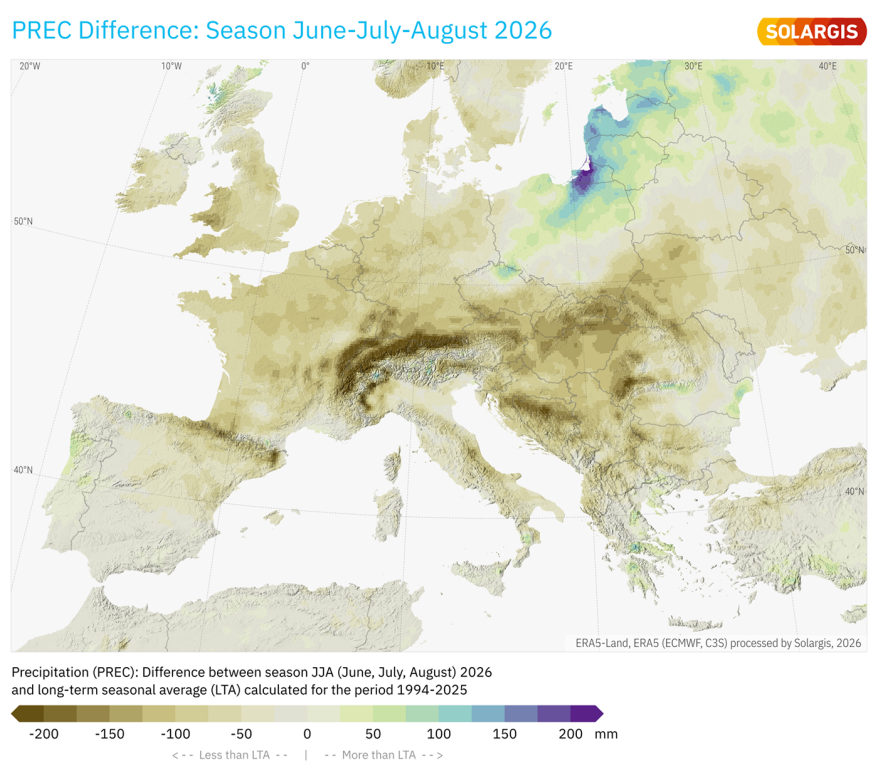
Diferença de precipitação entre a estação JJA de 2026 e a média sazonal de longo prazo na Europa.
Em contraste, o Norte da Europa, incluindo a Escandinávia, a Finlândia e a Escócia, registou um GHI abaixo da média, variando geralmente entre −5% e −25%. Estas áreas registaram também temperaturas próximas da média, combinadas com precipitação acima da média.
As anomalias do GHI variaram substancialmente entre os meses individuais da estação JJA, resultando num sinal sazonal relativamente equilibrado em grande parte da América do Norte. Observou-se um extremo local notável ao longo da costa atlântica do Panamá e da Costa Rica, onde o GHI diminuiu localmente em mais de −30%.
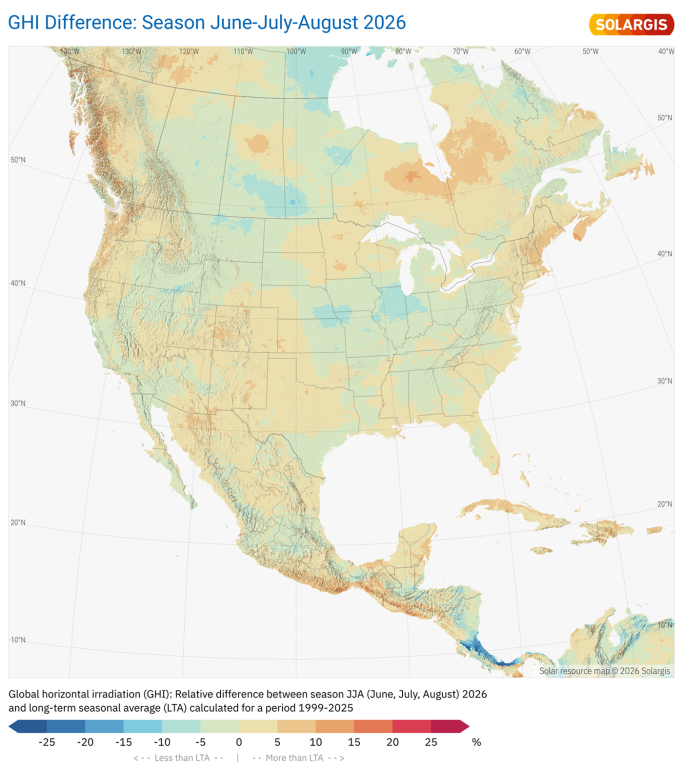
Diferença na irradiação horizontal global entre a estação JJA de 2026 e as médias sazonais de longo prazo na América do Norte e Central.
Foram observadas anomalias mais pronunciadas na precipitação, particularmente na América Central e na região do Golfo do México, onde se registaram défices substanciais de precipitação durante a estação.
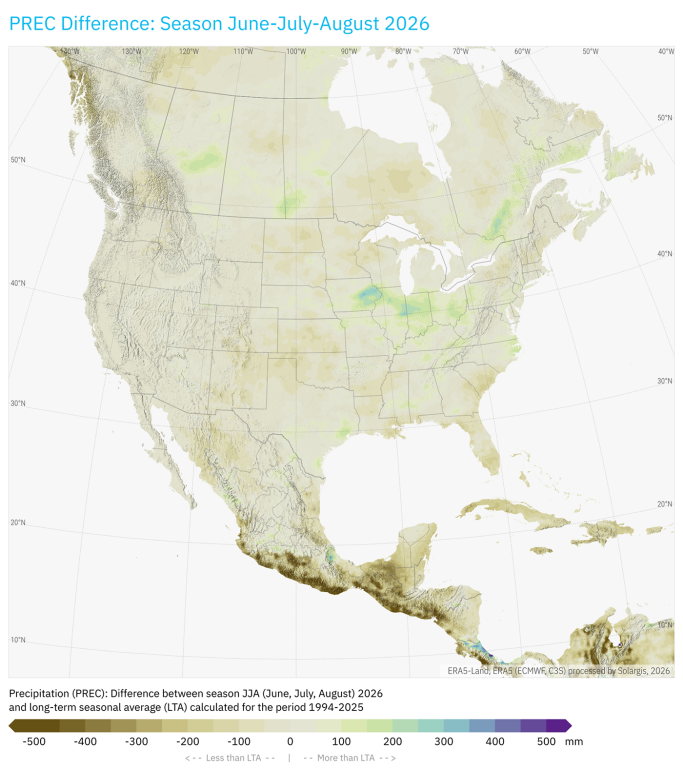
Diferença de precipitação entre a estação JJA de 2026 e a média sazonal de longo prazo na América do Norte e na América Central.
Do ponto de vista da temperatura, as anomalias de verão mais pronunciadas nos Estados Unidos continentais ocorreram nas regiões centrais, ultrapassando +2,5 °C acima da média de longo prazo. Numa perspetiva ambiental mais ampla, no entanto, as anomalias de temperatura mais preocupantes foram observadas no norte do Canadá, onde a temperatura média sazonal do ar excedeu +4 °C. A combinação de condições excecionalmente quentes e secas contribuiu para a ocorrência generalizada de incêndios florestais em toda a região.
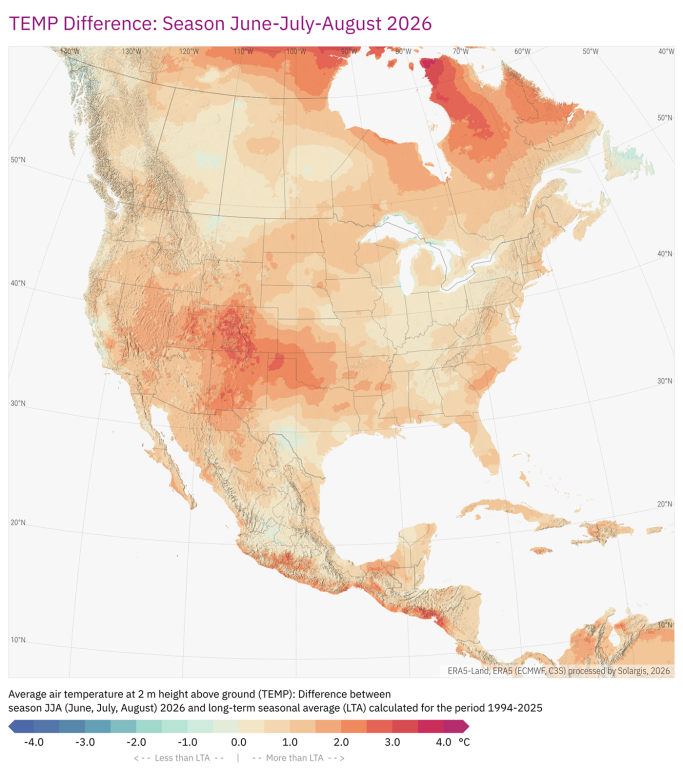
Temperaturas do ar a 2 m de altura acima do solo para a estação JJA de 2026, comparadas com as médias sazonais de longo prazo na América do Norte e Central.
Durante o período de julho a agosto de 2026, a monção afetou a Península Indiana de forma desigual, com os impactos mais fortes concentrados em regiões específicas. As anomalias mais pronunciadas ocorreram na Índia central e oriental, onde julho e agosto trouxeram uma nebulosidade excecional e precipitação altamente irregular, localmente extrema.
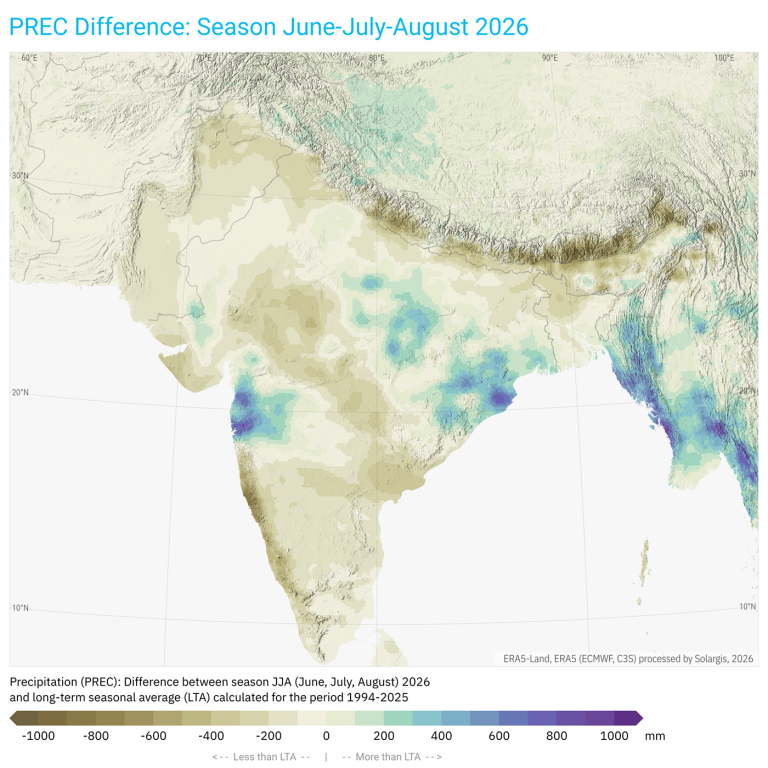
Diferença de precipitação entre a estação JJA de 2026 e a média sazonal de longo prazo na Índia.
Consequentemente, o recurso solar ficou significativamente abaixo da média a longo prazo. As anomalias do GHI variaram entre −5 % e −20 % em vários estados indianos, incluindo Madhya Pradesh, Chhattisgarh e Odisha, bem como no sul do Bangladesh e no noroeste de Mianmar. Anomalias negativas semelhantes foram também observadas na região montanhosa ao longo da costa sudoeste da Índia.
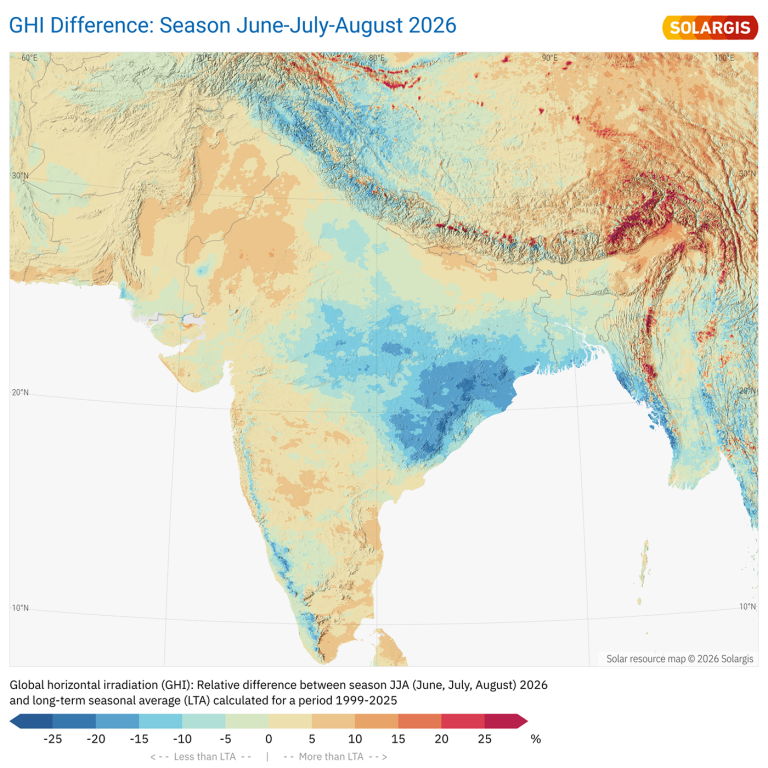
Diferença na irradiação horizontal global entre a estação de JJA de 2026 e as médias sazonais de longo prazo no subcontinente indiano.
Em contrapartida, as áreas menos afetadas pela monção mantiveram um saldo de recursos solares neutro ou positivo, variando geralmente entre 0 % e +20 %. Isto destaca o caráter altamente regional da estação das monções de 2026, em que a nebulosidade intensa e a precipitação reduziram a irradiação solar em algumas áreas, enquanto as regiões vizinhas se mantiveram próximas ou acima do normal.
Tal como observado nos últimos anos, uma das mais fortes anomalias positivas do GHI ocorreu na Bacia de Sichuan, na China, onde o GHI situou-se entre +5 % e +25 % acima da média a longo prazo. A região também apresentou uma tendência pronunciada de aumento da luminosidade nos últimos dois anos.
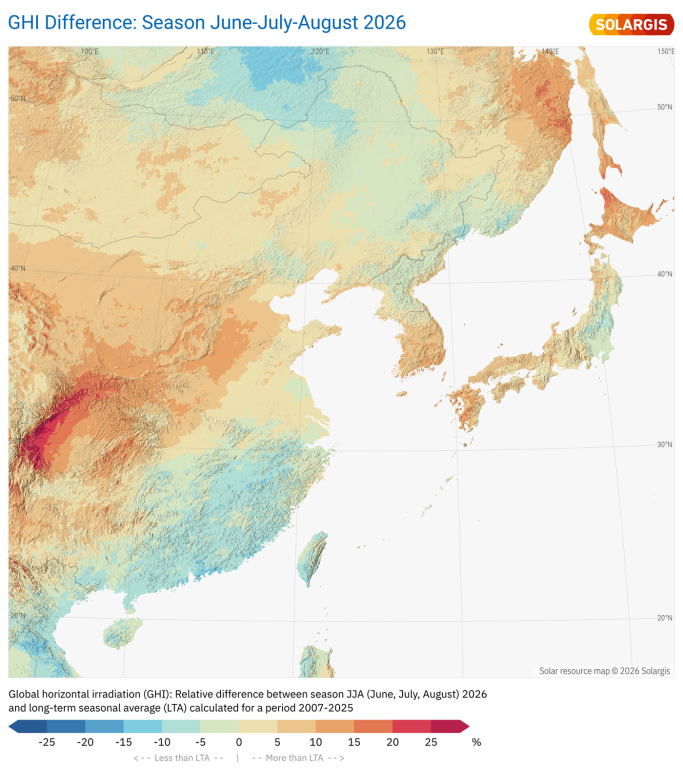
Diferença na irradiação horizontal global entre a estação de junho-julho-agosto de 2026 e as médias sazonais de longo prazo na Ásia Oriental.
De forma mais geral, a China central e a Mongólia registaram anomalias positivas do GHI que variaram entre +2 % e +15 %. Em contrapartida, o sudoeste da China, o Vietname e o norte das Filipinas registaram um GHI ligeiramente abaixo da média, variando geralmente entre −2 % e −12 %.
O Japão passou por um período de três meses altamente variável, com o país repetidamente dividido em padrões contrastantes entre o norte e o sul. As anomalias positivas e negativas alternaram-se de mês para mês, resultando num sinal sazonal JJA relativamente equilibrado, variando entre −6 % e +10 % na maior parte do país. A principal exceção foi Hokkaido, no norte, onde condições excepcionalmente ensolaradas em agosto resultaram numa anomalia da GHI de até +20 %.
É possível distinguir duas regiões contrastantes na África tropical e subtropical em termos de disponibilidade de recursos solares. Os países em torno do Golfo da Guiné registaram um GHI abaixo da média, com anomalias locais a descerem abaixo de −20%.
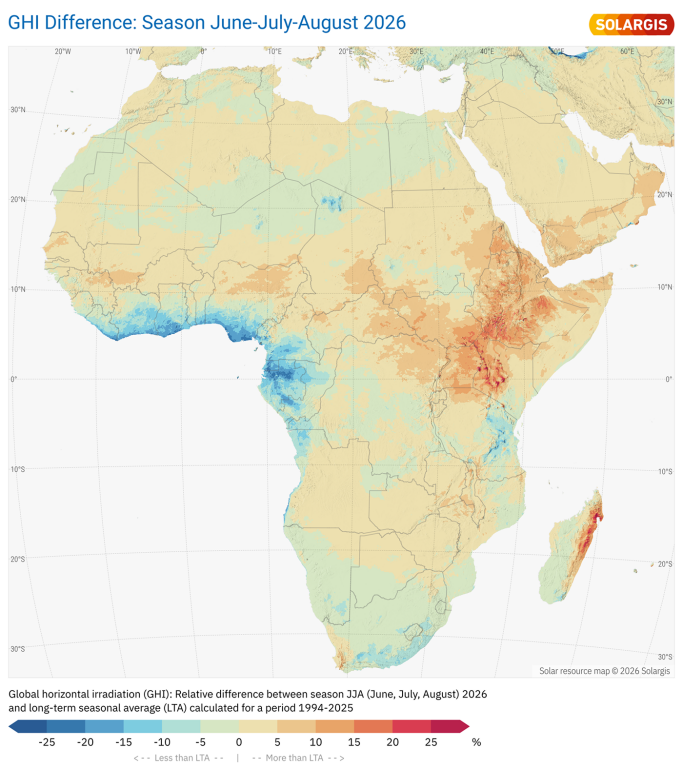
Diferença na irradiação horizontal global entre a estação JJA de 2026 e as médias sazonais de longo prazo no continente africano.
Em contrapartida, a África Central e Oriental, em particular o Quénia e a Etiópia, registaram um GHI acima da média, atingindo localmente +20%. Outra anomalia positiva pronunciada ocorreu ao longo da costa oriental de Madagáscar, onde as anomalias do GHI variaram entre +5% e +30%.
Do ponto de vista ambiental, os sinais mais preocupantes foram a combinação de temperaturas do ar acima da média e uma distribuição de precipitação altamente desigual.
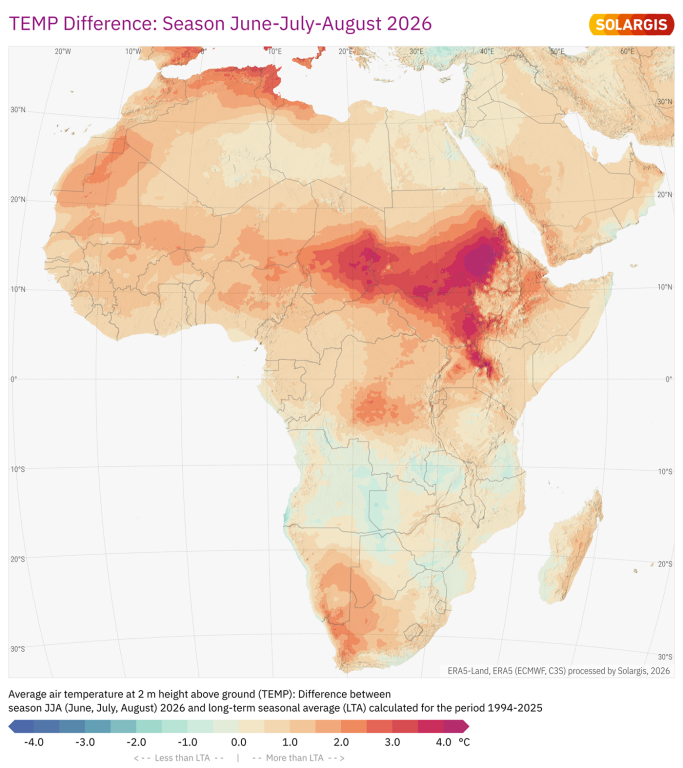
Temperaturas do ar a 2 m de altura acima do solo para a estação JJA de 2026, comparadas com as médias sazonais de longo prazo no continente africano.
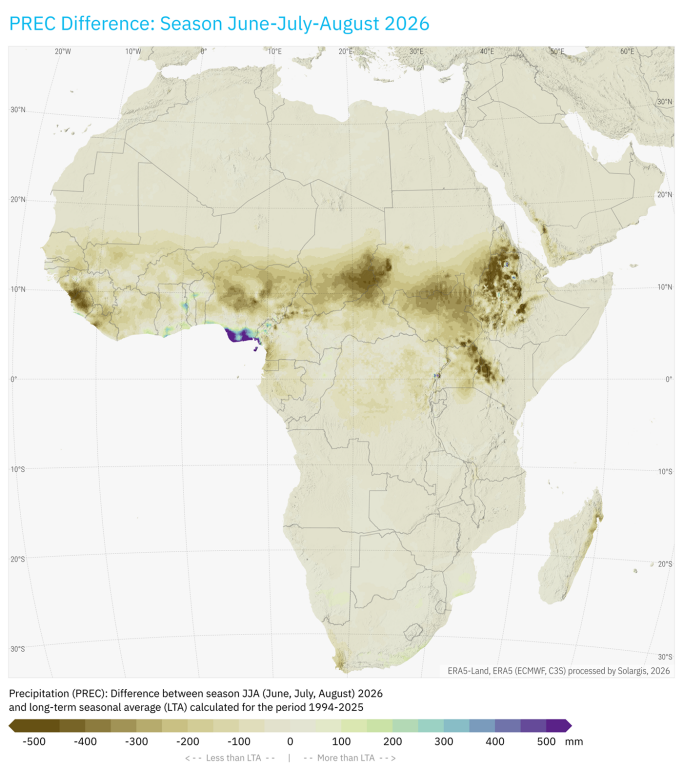
Diferença de precipitação entre a estação JJA de 2026 e a média sazonal de longo prazo no continente africano.
Áreas localizadas no sul da Nigéria, no Gana e no Togo receberam até o dobro da sua precipitação média de longo prazo. Ao mesmo tempo, grande parte da região subtropical do Sahel registou graves défices de precipitação ao longo do período JJA, com a precipitação sazonal a atingir frequentemente apenas 25–50 % da média de longo prazo.
Estas condições foram acompanhadas por temperaturas do ar substancialmente acima da média, particularmente no sul do Chade e no Sudão do Sul, onde as anomalias variaram entre +2 °C e +4 °C. Na Etiópia central, as anomalias locais de temperatura excederam os +4,5 °C.
Desenvolveu-se uma anomalia negativa notável na bacia do rio Paraná e nas áreas circundantes, incluindo o norte da Argentina, o Uruguai e o sul do Brasil.
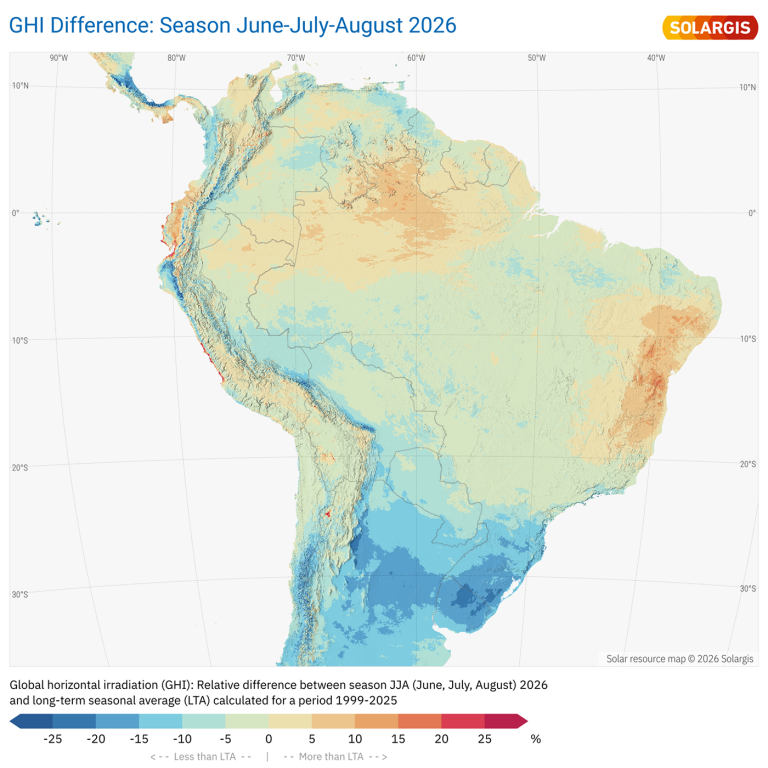
Diferença na irradiação horizontal global entre a estação JJA de 2026 e as médias sazonais de longo prazo na América do Sul.
A irradiação horizontal global (GHI) situou-se substancialmente abaixo da média, excedendo localmente os −20%. Ao mesmo tempo, a precipitação situou-se acima da média, resultando numa combinação acentuada de recursos solares reduzidos e condições mais húmidas do que o normal.
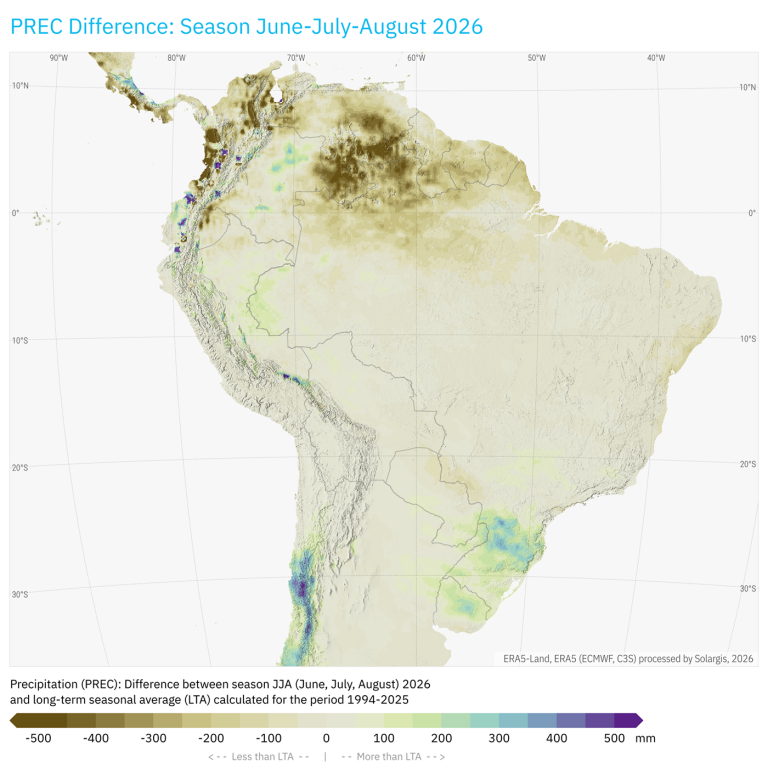
Diferença de precipitação entre a estação JJA de 2026 e a média sazonal de longo prazo na América do Sul.
De forma semelhante, o centro do Chile registou uma GHI substancialmente abaixo da média, atingindo localmente os −20%, associada a condições excecionalmente húmidas e nubladas em julho.
Em contraste, a Amazónia central, incluindo o norte do Brasil e a Venezuela, registou um padrão crescente de condições mais secas e ensolaradas. Isto é consistente com os impactos típicos relacionados com o fenómeno El Niño na região.
A Malásia, a Indonésia, o sul das Filipinas e a Papua-Nova Guiné registaram um GHI excepcionalmente elevado, ultrapassando localmente +30% acima da média de longo prazo. As anomalias mais fortes ocorreram em partes da Papua-Nova Guiné, Sulawesi, nas Ilhas Sula, Buru, Seram, Halmahera e no leste de Bornéu.
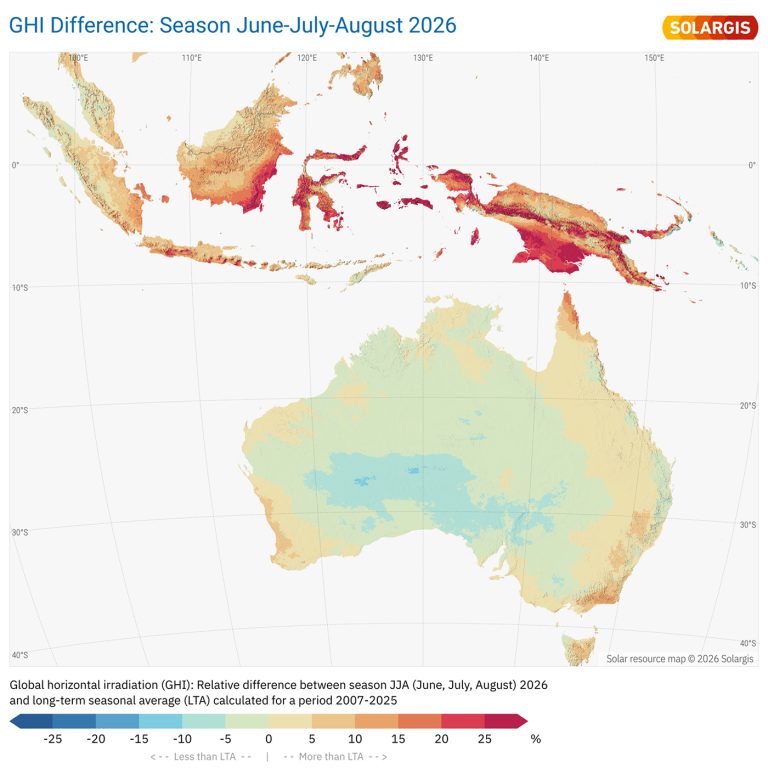
Diferença na irradiação horizontal global entre a estação JJA de 2026 e as médias sazonais de longo prazo na Austrália e no Sudeste Asiático.
Padrões semelhantes foram observados durante a estação JJA do mais recente fenómeno El Niño forte, em 2015, mas a magnitude das anomalias foi consideravelmente menor. A região registou também precipitação substancialmente abaixo da média.
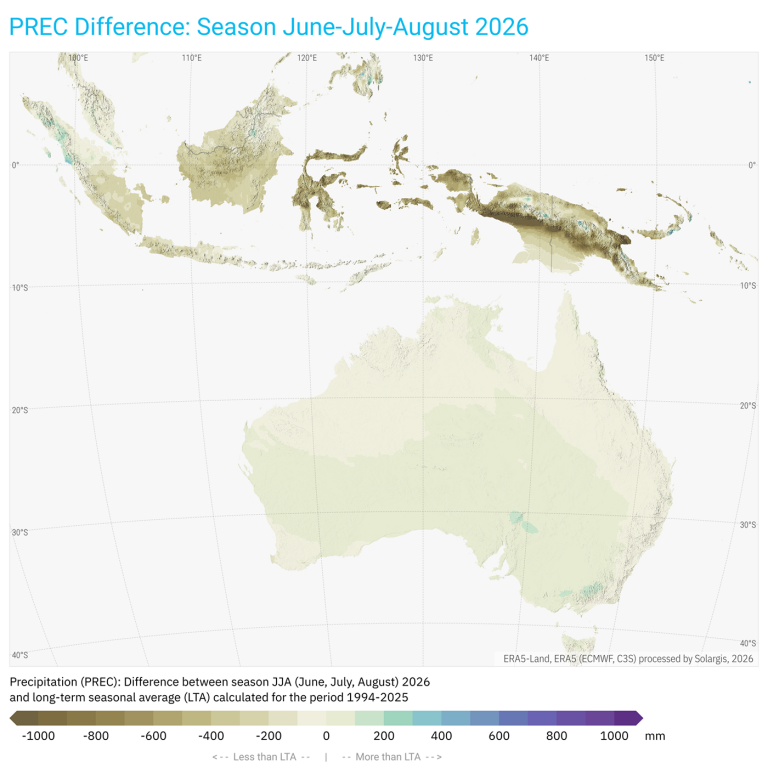
Diferença de precipitação entre a estação JJA de 2026 e a média sazonal de longo prazo na Austrália e no Sudeste Asiático.
A Austrália Central registou uma irradiação horizontal global (GHI) abaixo da média, com anomalias locais a atingirem os −10%. As regiões costeiras da Austrália e da Nova Zelândia mantiveram-se próximas ou acima da média, em parte devido a condições excepcionalmente ensolaradas em julho.
De acordo com a Administração Nacional Oceânica e Atmosférica (NOAA), as condições de El Niño continuaram a desenvolver-se rapidamente durante a estação JJA deste ano, vários meses mais cedo do que o habitual durante os eventos de El Niño. Os indicadores de El Niño desta estação apontam para um evento potencialmente invulgarmente forte.
Estes padrões refletem-se em anomalias espacialmente contrastantes do recurso solar (GHI, irradiação horizontal global) e da precipitação.
O índice RONI atingiu +1,4 °C, o que representa um valor +0,1 °C superior ao registado durante o último evento forte de El Niño, em 2015. A temperatura da superfície do mar no Pacífico tropical central (região do Niño 3.4) ultrapassou os 29,4 °C em agosto, o valor mais elevado para o mês de agosto registado desde o início das observações.
A evolução das condições do El Niño constituiu um importante sinal de fundo durante o verão de 2026.
O El Niño afeta a circulação atmosférica, a nebulosidade, a precipitação e os padrões de temperatura em muitas regiões. A sua influência não é uniforme e as respostas regionais podem diferir significativamente. Isto ficou patente nos padrões contrastantes observados na região do Pacífico, na América do Sul, na Papua, na Indonésia e em partes do Sudeste Asiático.
No que diz respeito à energia solar, isto é importante porque as anomalias provocadas pelo El Niño podem influenciar tanto o desempenho fotovoltaico a curto prazo como as expectativas a longo prazo. Em algumas regiões, o efeito pode manifestar-se através de um aumento da nebulosidade e da precipitação. Noutras, pode contribuir para condições mais claras, secas e ensolaradas.
É por isso que a monitorização de sinais climáticos em grande escala, a par de dados de recursos solares de alta resolução, é essencial para compreender os desvios sazonais em relação às médias a longo prazo.
As anomalias sazonais não são apenas curiosidades meteorológicas. Influenciam diretamente o desempenho fotovoltaico, as expectativas de receitas, a gestão de ativos e as decisões operacionais.
Um mês ou uma estação com irradiação acima da média pode melhorar a produção a curto prazo. Por outro lado, uma anomalia negativa prolongada pode criar discrepâncias entre o rendimento esperado e o rendimento real, que têm de ser explicadas aos investidores, financiadores e proprietários de ativos.
Na prática, cada relatório de desempenho começa com uma pergunta simples: a central produziu o que se esperava que produzisse?
Para responder adequadamente a esta pergunta, as equipas precisam de separar os efeitos decorrentes dos recursos dos efeitos decorrentes da central e da rede. Isso requer dados fiáveis de irradiação, dados de temperatura e vento, informações sobre aerossóis, contexto de precipitação e um modelo de recursos solares capaz de ter em conta eventos excecionais.
A época de junho a agosto de 2026 demonstrou, mais uma vez, que a variabilidade dos recursos solares não está distribuída uniformemente pelo mundo. Algumas regiões beneficiaram de condições solares excecionais, enquanto outras registaram défices acentuados devido à nebulosidade, precipitação, aerossóis atmosféricos ou padrões climáticos mais amplos.
Para promotores, operadores, gestores de ativos e investidores, isto reforça a importância de trabalhar com dados solares validados e de alta resolução, bem como com séries temporais atualizadas regularmente. Só assim é possível compreender corretamente as anomalias sazonais e traduzi-las em melhores decisões para os ativos fotovoltaicos.