本页未翻译。您正在浏览的是英文版本。

The June–July–August 2026 season brought several notable regional extremes in solar irradiation, temperature, and precipitation.

While some regions experienced exceptionally hot and sunny conditions, others recorded significant irradiation deficits, driven by persistent cloudiness, intensified monsoon activity, or unusual rain patterns. At the same time, heatwaves, wildfires, and broader climate signals such as the evolving ENSO (El Niño–Southern Oscillation) conditions added further complexity to PV performance analysis.

These contrasts are clearly visible in the Solargis difference maps, which compare the aggregated June-July-August (JJA) 2026 season with long-term averages (LTA). 

Let’s take a closer look at the maps, see where this season deviated from normal conditions, and explore why these deviations matter for PV asset performance, reporting, and planning.

Maps: Strong regional contrasts across the globe

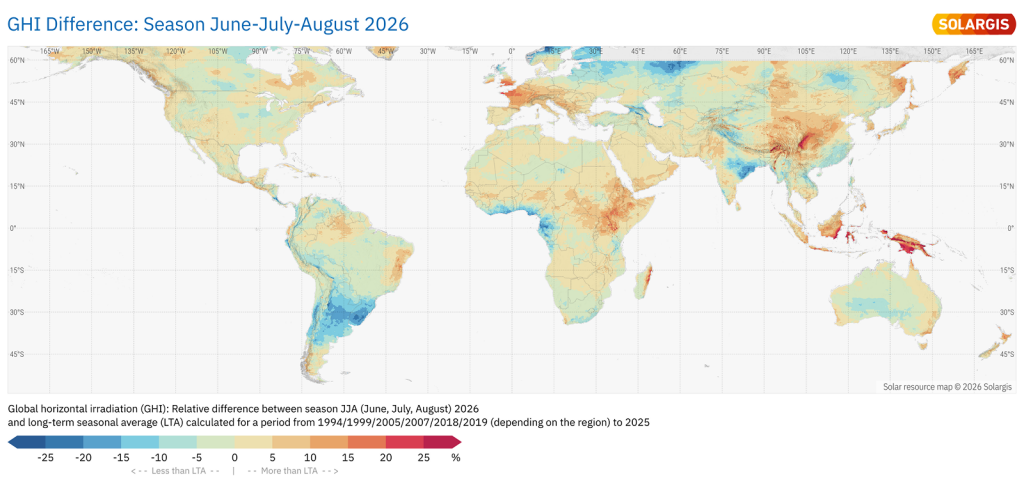
The JJA (June–July–August) season of 2026 was marked by strong regional variability. Some regions recorded exceptionally sunny conditions, including parts of Western Europe, Central-West India, East Indonesia, Central China, and selected areas of the Western Pacific.

At the same time, other regions saw substantially reduced irradiation, including Scandinavia, North Britain, Central USA, Southern Japan, Eastern India, parts of South America, and several monsoon-affected areas.

GHIdiff 2026JJA vs LTA world 1

Global horizontal irradiation difference between JJA 2026 season and long-term seasonal averages.

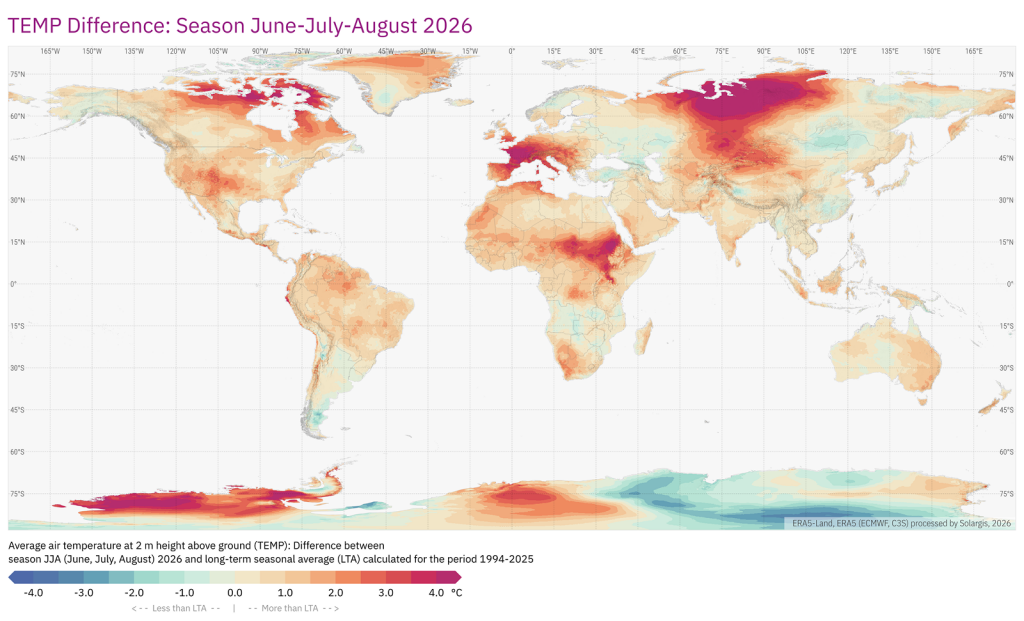
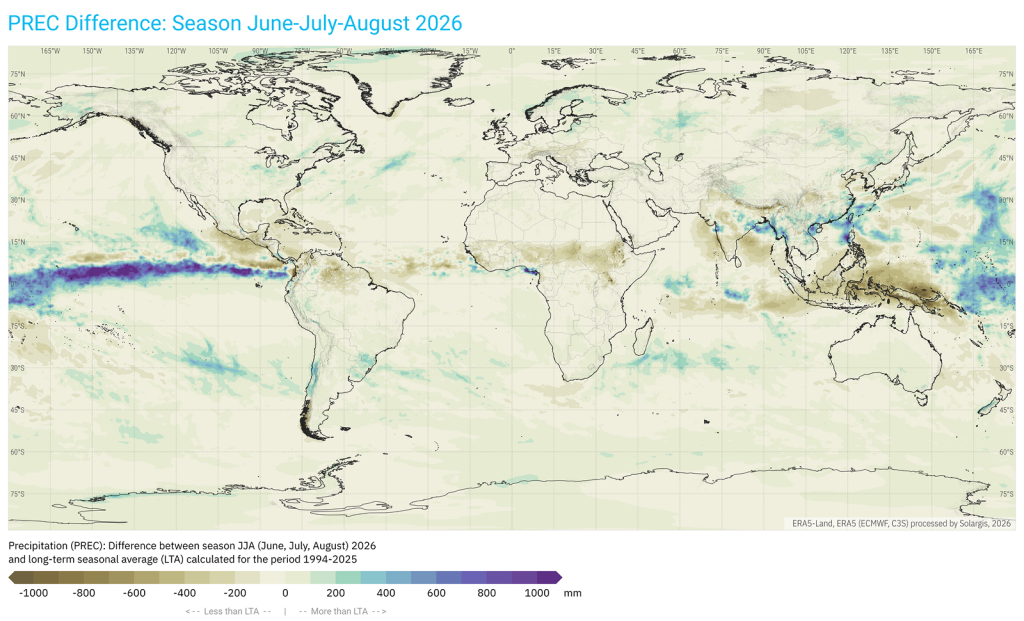
These contrasts were closely linked to broader meteorological patterns: heatwaves and dry conditions in Western Europe, intense monsoon activity in parts of South Asia, precipitation deficits elsewhere in India, and evolving ENSO conditions affecting the Pacific and adjacent regions.

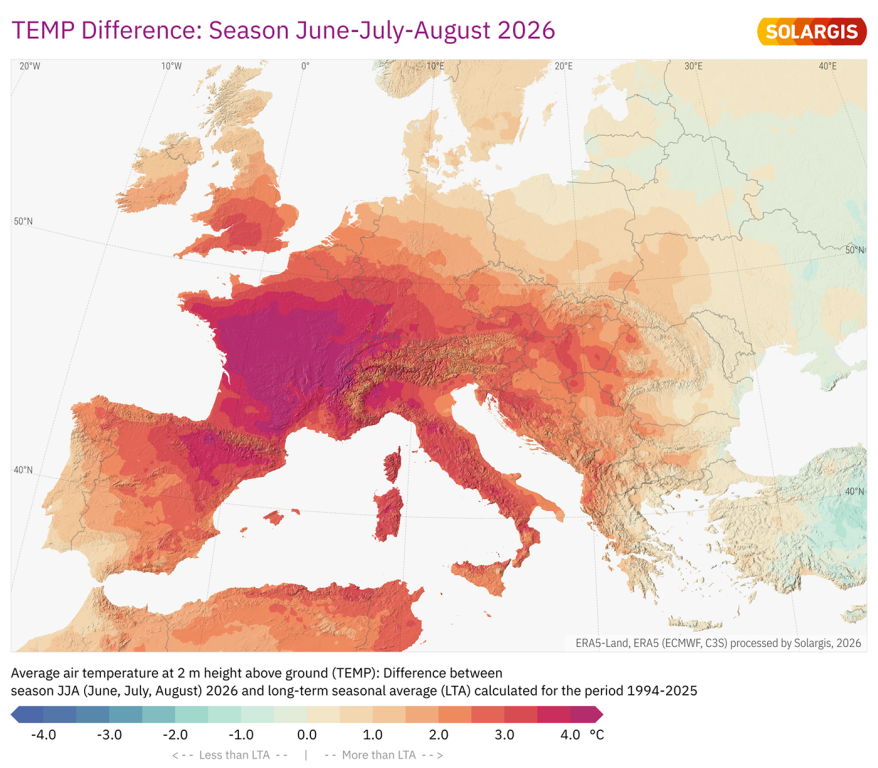
TEMPdiff 2026JJA vs LTA world 1

Air temperature at 2 m height above ground for the JJA 2026 season compared to long-term seasonal averages.

PRECdiff 2026JJA vs LTA world 1

Precipitation difference between JJA 2026 season and long-term seasonal average.

Europe: Exceptionally warm and dry summer

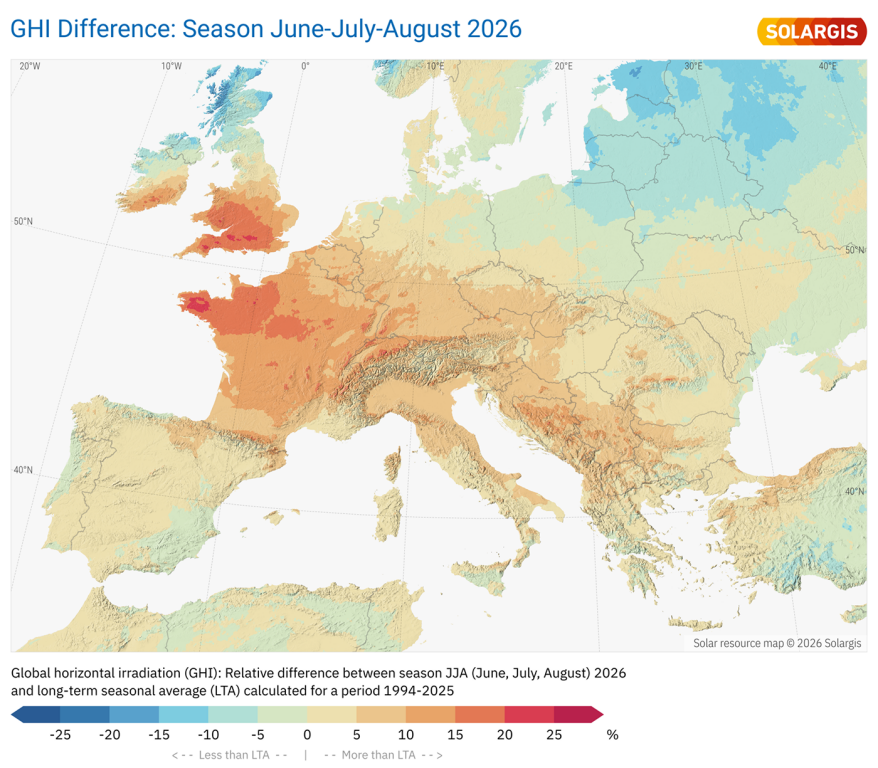
Much of Europe, particularly its central and western regions, experienced one of the warmest and driest summers on record, accompanied by above-average GHI.

GHIdiff 2026JJA vs LTA eur 1

Global horizontal irradiation difference between JJA 2026 season and long-term seasonal averages in the European continent.

Southern England, Wales, and Normandy recorded GHI anomalies exceeding +20%. Most of Central Europe and the Balkans also saw above-average GHI, generally ranging from +5% to +15%.

Seasonal average air temperature anomalies typically ranged from +2°C to +4°C, reaching approximately +4.5°C in parts of Central France. Combined with prolonged dry conditions, this contributed to severe wildfire activity in July, when more than 70,000 hectares burned in France, marking the country’s largest wildfire season since 1949.

TEMPdiff 2026JJA vs LTA eur 1

Air temperatures at 2 m height above ground for the JJA 2026 season compared to long-term seasonal averages in Europe.

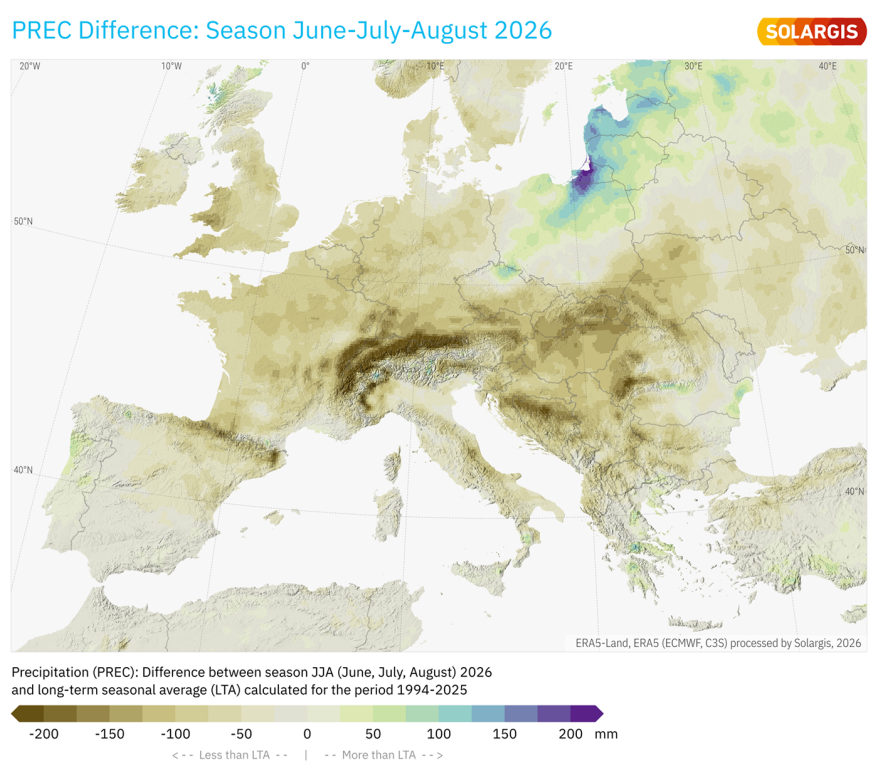
Precipitation deficits were widespread across Western and Central Europe. Many regions recorded seasonal precipitation 50% below normal, with local deficits reaching as much as −80%.

In Central Europe, the persistent lack of rainfall reinforced already dry soil and vegetation conditions. Together with above-average temperatures and high solar irradiation, this dryness intensified heat stress and contributed to elevated wildfire risk across affected regions.

PRECdiff 2026JJA vs LTA eur 1

Precipitation difference between JJA 2026 season and long-term seasonal average in Europe.

In contrast, Northern Europe, including Scandinavia, Finland and Scotland, experienced below-average GHI, generally ranging from −5% to −25%. These areas also recorded near-average temperatures combined with above-average precipitation.

North and Central America: Substantial precipitation deficits

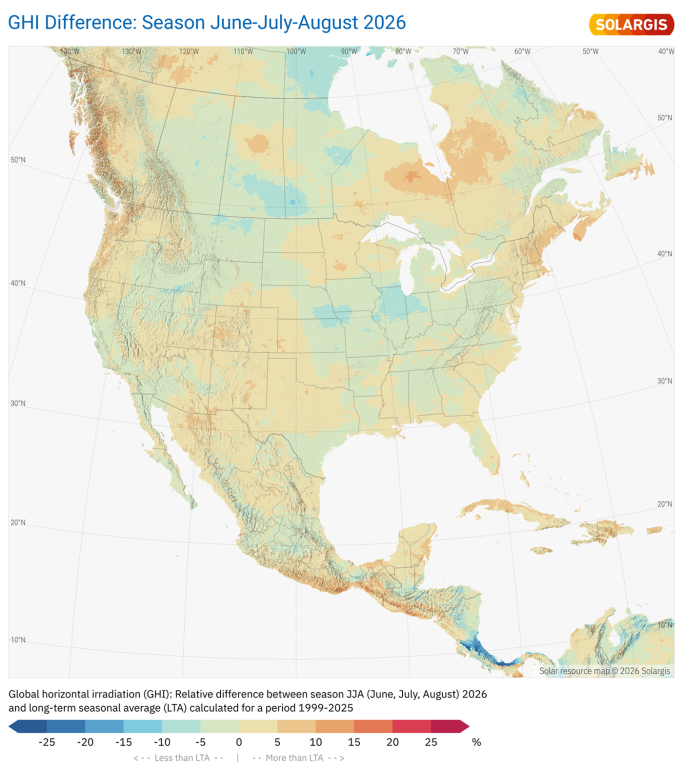
GHI anomalies varied substantially between individual months of the JJA season, resulting in a relatively balanced seasonal signal across much of North America. One notable local extreme was observed along the Atlantic coast of Panama and Costa Rica, where GHI locally decreased by more than −30%.

GHIdiff 2026JJA vs LTA north america 1

Global horizontal irradiation difference between JJA 2026 season and long-term seasonal averages in North and Central America.

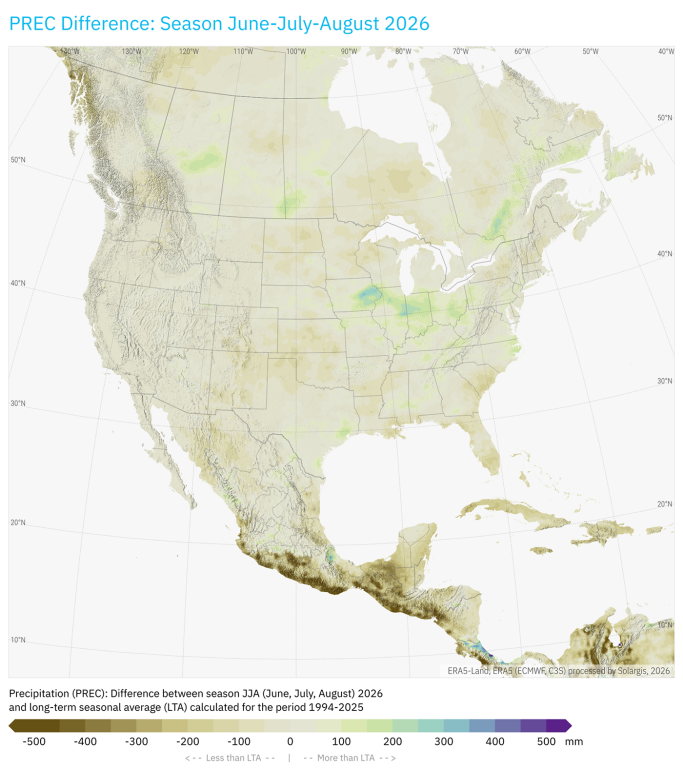
More pronounced anomalies were observed in precipitation, particularly across Central America and the Gulf of Mexico region, where substantial precipitation deficits occurred during the season.

PRECdiff 2026JJA vs LTA north america 1

Precipitation difference between JJA 2026 season and long-term seasonal average in North and Central America.

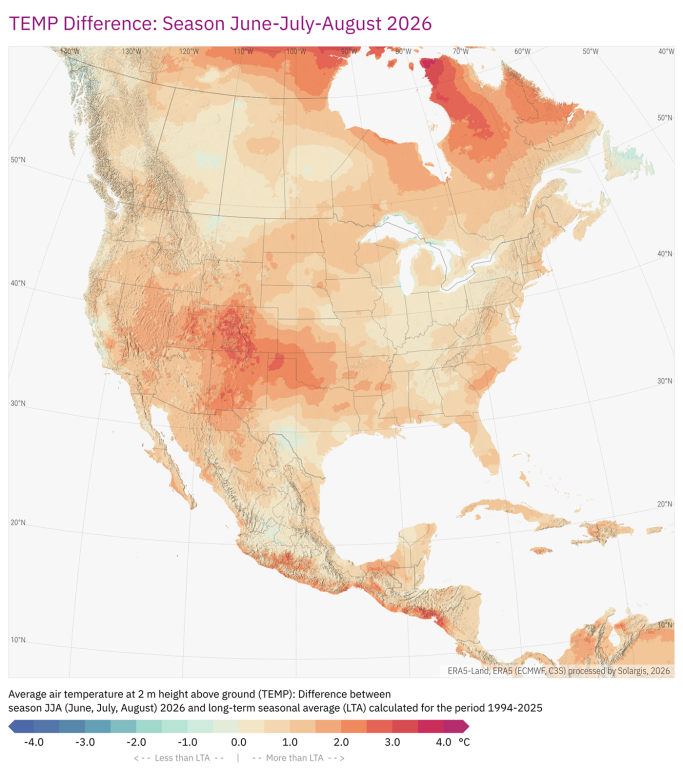
From a temperature perspective, the most pronounced summer anomalies in the continental United States occurred across the central regions, exceeding +2.5°C above the long-term average. From a broader environmental perspective, however, the most concerning temperature anomalies were observed across northern Canada, where seasonal average air temperature exceeded +4°C. The combination of exceptionally warm and dry conditions contributed to widespread wildfire activity across the region.

TEMPdiff 2026JJA vs LTA north america 1

Air temperatures at 2 m height above ground for the JJA 2026 season compared to long-term seasonal averages in North and Central America.

India: Exceptional cloudiness and uneven monsoon precipitation

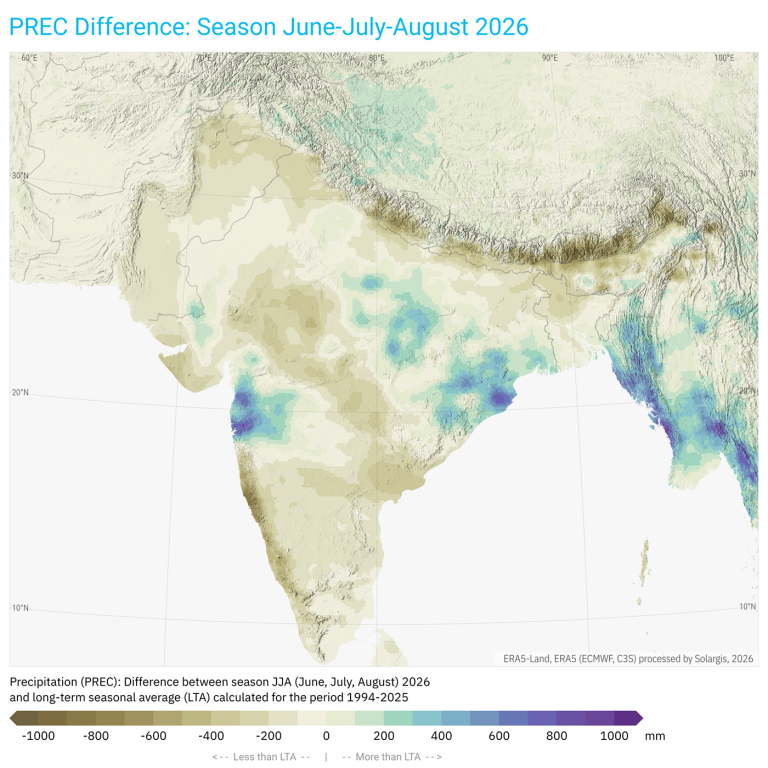
During the JJA period, the monsoon affected the Indian Peninsula unevenly, with the strongest impacts concentrated in selected regions. The most pronounced anomalies occurred across central and eastern India, where July and August brought exceptional cloudiness and highly uneven, locally extreme precipitation.

PRECdiff 2026JJA vs LTA india 1

Precipitation difference between JJA 2026 season and long-term seasonal average in India.

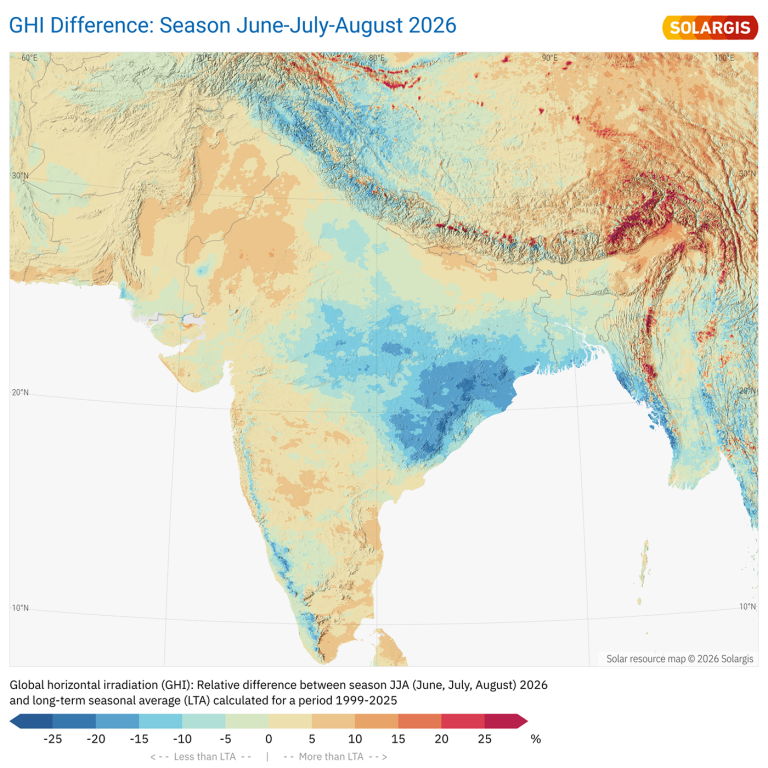
As a result, the solar resource was significantly below the long-term average. GHI anomalies ranged from −5% to −20% across several Indian states, including Madhya Pradesh, Chhattisgarh, and Odisha, as well as southern Bangladesh and northwestern Myanmar. Similar negative anomalies were also observed in the mountainous region along India’s southwestern coast.

GHIdiff 2026JJA vs LTA india 1

Global horizontal irradiation difference between JJA 2026 season and long-term seasonal averages in the subcontinent of India.

In contrast, areas that were less affected by the monsoon maintained a neutral or positive solar resource balance, generally ranging from 0% to +20%. This highlights the highly regional character of the 2026 monsoon season, where intense cloudiness and precipitation reduced solar irradiation in some areas, while neighbouring regions remained close to or above normal.

East Asia: Alternating positive and negative anomalies

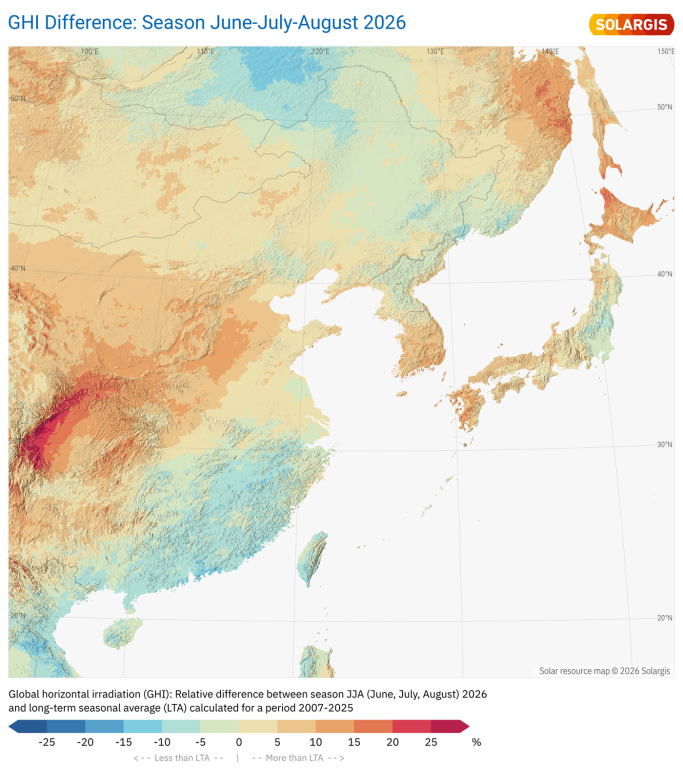
As observed in recent years, one of the strongest positive GHI anomalies occurred in the Sichuan Basin of China, where GHI was +5% to +25% above the long-term average. The region has also exhibited a pronounced brightening trend over the past two years.

GHIdiff 2026JJA vs LTA east asia 1

Global horizontal irradiation difference between JJA 2026 season and long-term seasonal averages in East Asia.

More broadly, central China and Mongolia recorded positive GHI anomalies ranging from +2% to +15%. In contrast, southwestern China, Vietnam and the northern Philippines experienced slightly below-average GHI, generally ranging from −2% to −12%.

Japan experienced a highly variable three-month period, with the country repeatedly divided into contrasting northern and southern patterns. Positive and negative anomalies alternated between months, resulting in a relatively balanced JJA seasonal signal, ranging from −6% to +10% across most of the country. The main exception was Hokkaido in the north, where exceptionally sunny conditions in August resulted in a GHI anomaly of up to +20%.

Africa: Contrasting solar resource patterns across tropical and subtropical regions

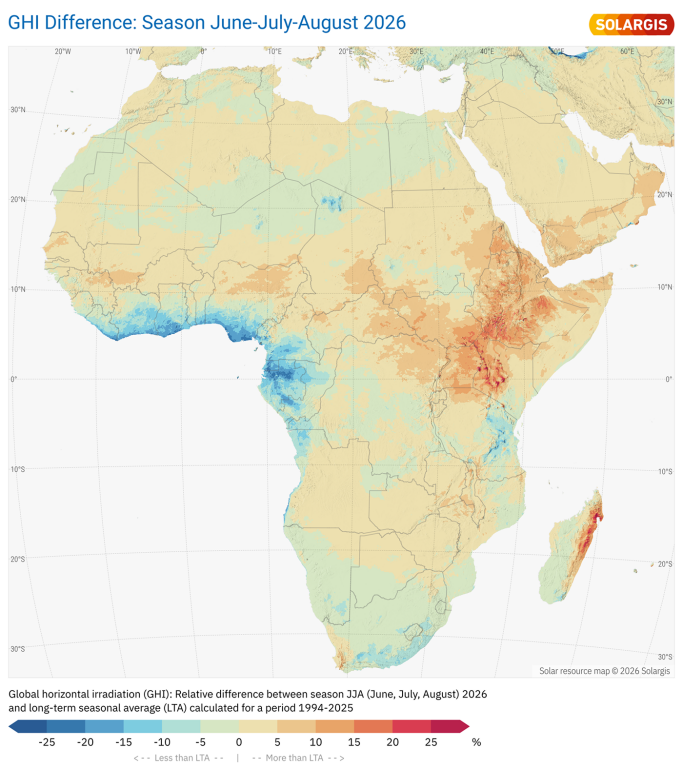
Two contrasting regions can be distinguished across tropical and subtropical Africa in terms of solar resource availability. Countries around the Gulf of Guinea experienced below-average GHI, with local anomalies falling below −20%.

GHIdiff 2026JJA vs LTA africa 1

Global horizontal irradiation difference between JJA 2026 season and long-term seasonal averages on the African continent.

In contrast, Central and Eastern Africa, particularly Kenya and Ethiopia, recorded above-average GHI, locally reaching +20%. Another pronounced positive anomaly occurred along the eastern coast of Madagascar, where GHI anomalies ranged from +5% to +30%.

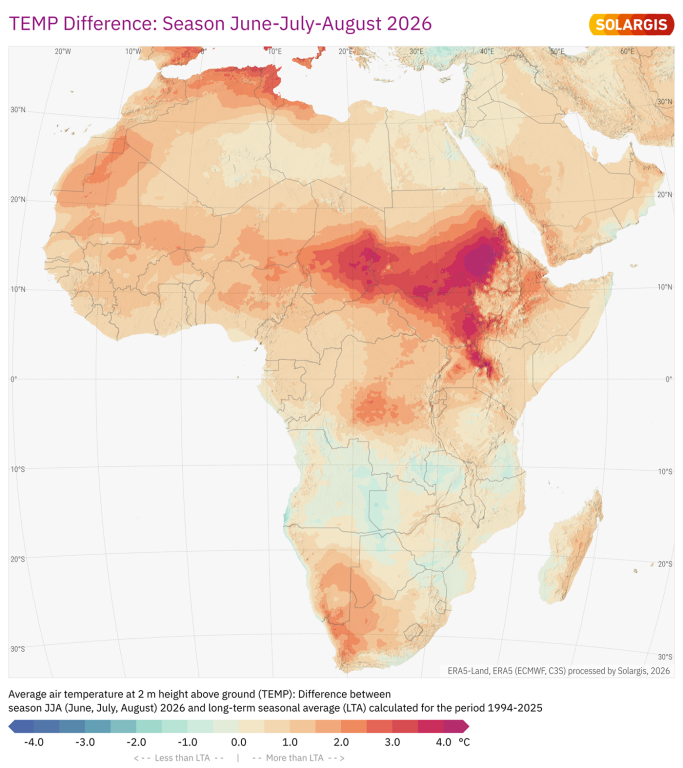
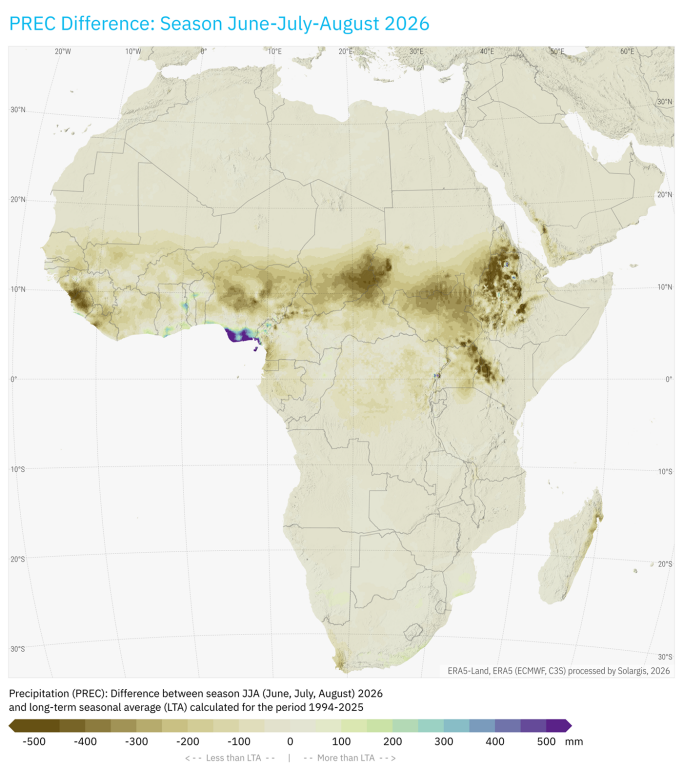
From an environmental perspective, the most concerning signals were the combination of above-average air temperatures and highly uneven precipitation distribution.

TEMPdiff 2026JJA vs LTA africa 1

Air temperatures at 2 m height above ground for the JJA 2026 season compared to long-term seasonal averages on the African continent.

PRECdiff 2026JJA vs LTA africa 1

Precipitation difference between JJA 2026 season and long-term seasonal average on the African continent.

Localized areas in southern Nigeria, Ghana, and Togo received up to twice their long-term average precipitation. At the same time, much of the subtropical Sahel region experienced severe precipitation deficits throughout the JJA period, with seasonal precipitation often reaching only 25–50% of the long-term average.

These conditions were accompanied by substantially above-average air temperatures, particularly across southern Chad and South Sudan, where anomalies ranged from +2°C to +4°C. In central Ethiopia, local temperature anomalies exceeded +4.5°C.

South America: Notable negative anomalies

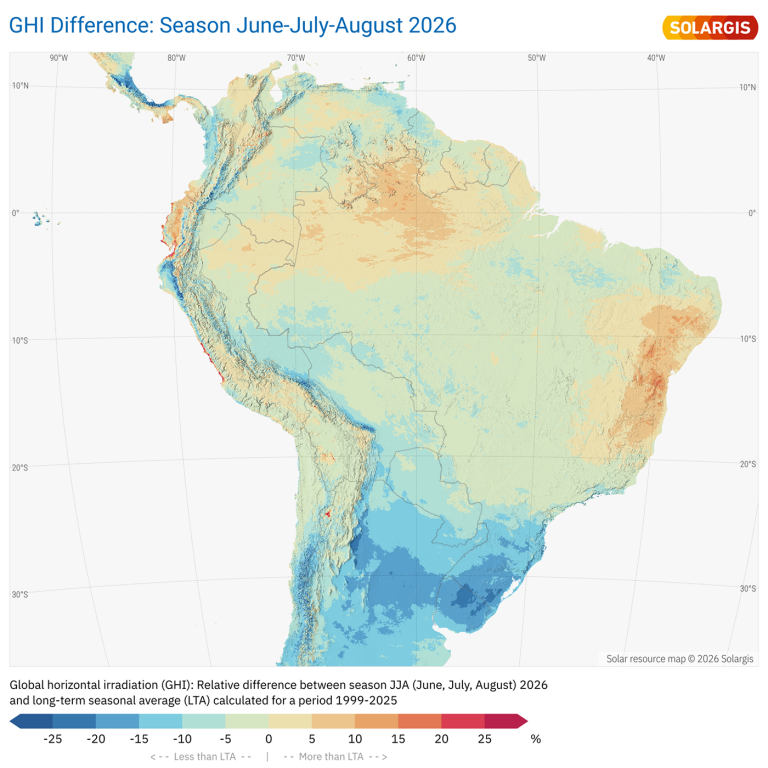
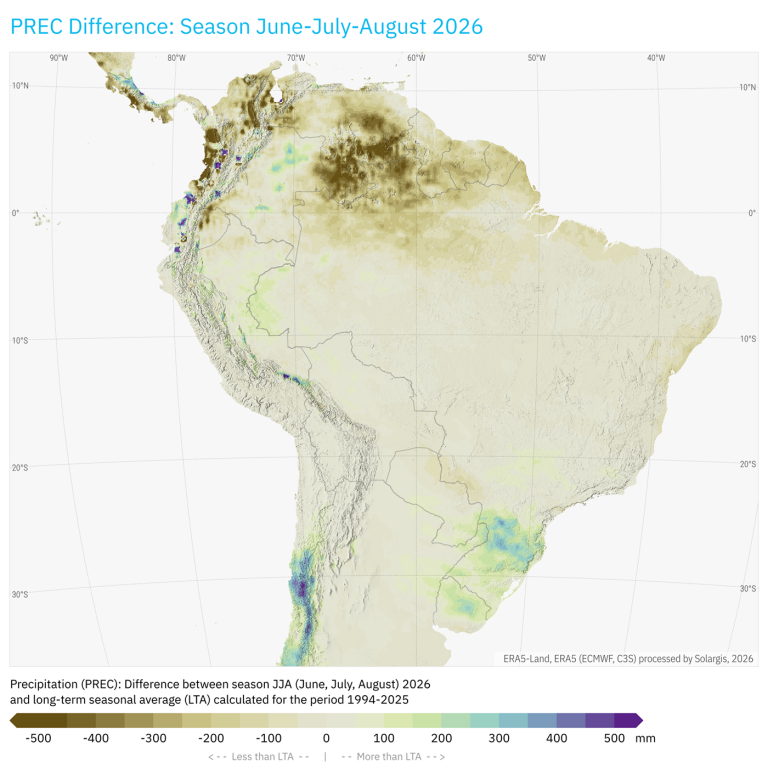
A notable negative anomaly developed across the Paraná River Basin and surrounding areas, including northern Argentina, Uruguay and southern Brazil.

GHIdiff 2026JJA vs LTA south america 1

Global horizontal irradiation difference between JJA 2026 season and long-term seasonal averages in South America.

GHI was substantially below average, locally exceeding −20%. At the same time, precipitation was above average, resulting in a pronounced combination of reduced solar resource and wetter-than-normal conditions.

PRECdiff 2026JJA vs LTA south america 1

Precipitation difference between JJA 2026 season and long-term seasonal average in South America.

Similarly, Central Chile experienced substantially below-average GHI, locally reaching −20%, associated with exceptionally wet and cloudy conditions in July.

In contrast, central Amazonia, including northern Brazil and Venezuela, experienced a developing pattern of drier and sunnier conditions. This is consistent with typical El Niño-related impacts in the region.

Australia and Southeast Asia: Strong positive anomalies across the western Pacific

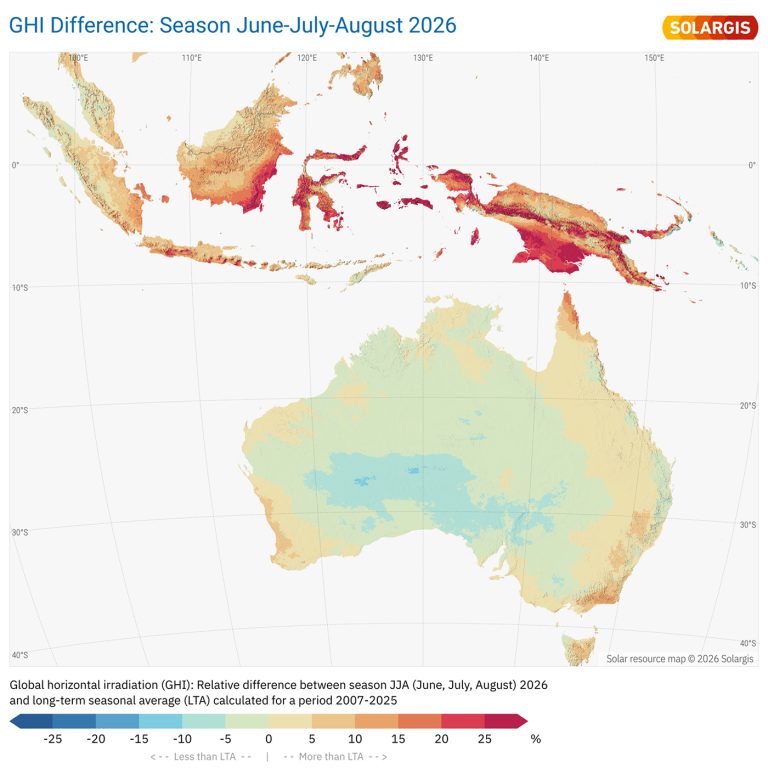
Malaysia, Indonesia, the southern Philippines and Papua New Guinea experienced exceptionally high GHI, locally exceeding +30% above the long-term average. The strongest anomalies occurred across parts of Papua New Guinea, Sulawesi, the Sula Islands, Buru, Seram, Halmahera and eastern Borneo. 

GHIdiff 2026JJA vs LTA australia 1

Global horizontal irradiation difference between JJA 2026 season and long-term seasonal averages in Australia and Southeast Asia.

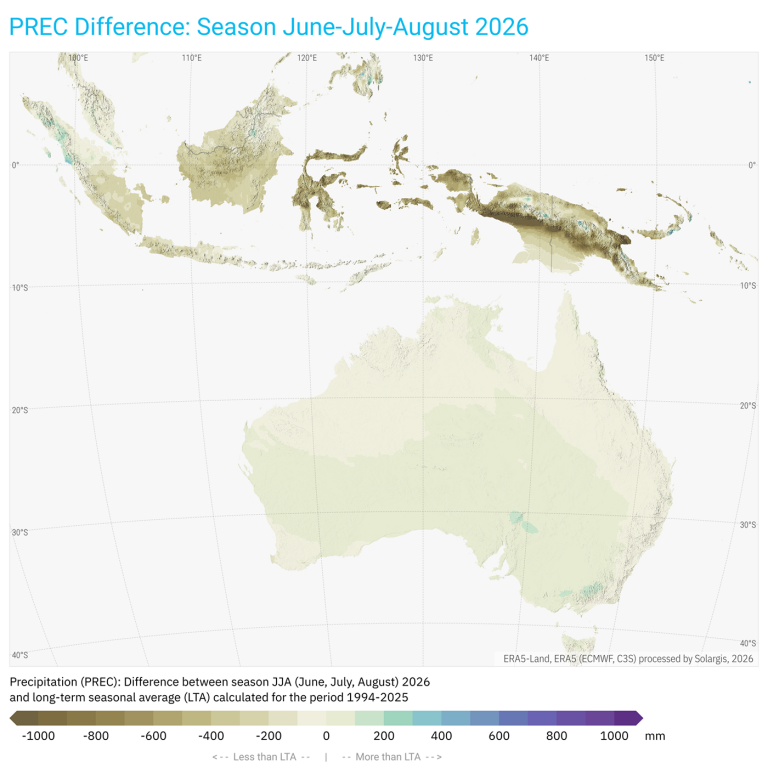
Similar patterns were observed during the JJA season of the most recent strong El Niño event in 2015, but the magnitude of the anomalies was considerably lower. The region also experienced substantially below-average precipitation.

PRECdiff 2026JJA vs LTA australia 1

Precipitation difference between JJA 2026 season and long-term seasonal average in Australia and Southeast Asia.

Central Australia experienced below-average GHI, with local anomalies reaching −10%. Coastal regions of Australia and New Zealand remained close to or above average, partly due to exceptionally sunny conditions in July.

El Niño as an important background signal

According to the National Oceanic and Atmospheric Administration (NOAA), El Niño conditions continued to develop rapidly during this year’s JJA season, several months earlier than is usual during El Niño events. This season’s El Niño indicators point to a potentially unusually strong event.

These patterns are reflected in spatially contrasting solar resource (GHI, global horizontal irradiation) and precipitation anomalies.

The RONI index reached +1.4°C, which is +0.1°C higher than during the latest strong El Niño event in 2015. Sea-surface temperature in the central tropical Pacific (Niño 3.4 region) exceeded 29.4 °C in August, the highest August value in the observational record.

The evolving El Niño conditions were an important background signal during summer 2026.

El Niño affects atmospheric circulation, cloudiness, precipitation, and temperature patterns across many regions. Its influence is not uniform, and regional responses can differ significantly. This was visible in the contrasting patterns observed across the Pacific region, South America, Papua, Indonesia, and parts of Southeast Asia.

For solar energy, this matters because El Niño-driven anomalies can influence both short-term PV performance and long-term expectations. In some regions, the effect may appear as increased cloudiness and precipitation. In others, it may contribute to clearer, drier, and sunnier conditions.

This is why monitoring large-scale climate signals alongside high-resolution solar resource data is essential for understanding seasonal deviations from long-term averages.

Why seasonal solar resource monitoring matters

Seasonal anomalies are not just meteorological curiosities. They directly influence PV performance, revenue expectations, asset management, and operational decisions.

A month or season with above-average irradiation may improve short-term production. A sustained negative anomaly, on the other hand, can create gaps between expected and actual yield that need to be explained to investors, lenders, and asset owners.

In practice, each performance report starts with a simple question: did the plant produce what it was expected to produce?

To answer this properly, teams need to separate resource-driven effects from plant-driven and grid-driven effects. That requires reliable irradiance data, temperature and wind data, aerosol information, precipitation context, and a solar resource model that can account for exceptional events.

The JJA 2026 season showed once again that solar resource variability is not evenly distributed across the world. Some regions benefited from exceptional solar conditions, while others experienced strong deficits driven by cloudiness, precipitation, atmospheric aerosols, or broader climate patterns.

For developers, operators, asset managers, and investors, this reinforces the importance of working with high-resolution, validated solar data and regularly updated time series. Only then can seasonal anomalies be understood correctly and translated into better decisions for PV assets.

Keep reading

Extreme weather and variability are testing the limits of solar software
Best practices

Extreme weather and variability are testing the limits of solar software

The higher frequency of the extreme weather puts growing pressure on the PV industry to design power plants that can withstand harsher conditions. Beyond this, developers must consider the potential losses from the extreme weather events and the likelihood of their occurrence.

Summer 2025 Review: Solar irradiation difference maps of June-July-August season
Solargis news

Summer 2025 Review: Solar irradiation difference maps of June-July-August season

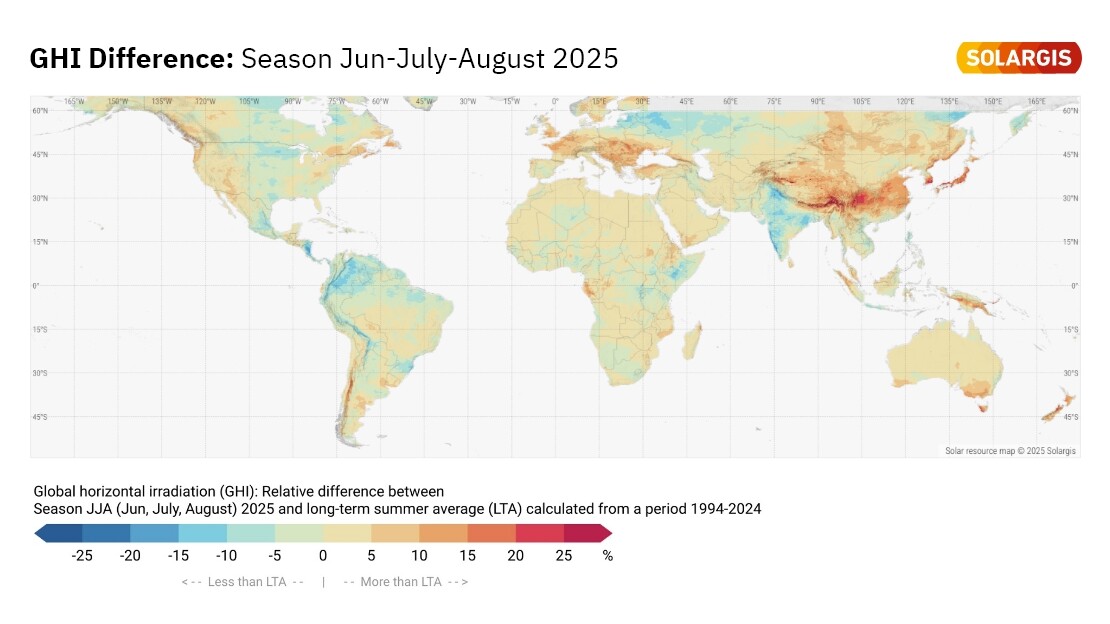
During June, July, and August 2025 — corresponding to summer in the Northern Hemisphere and winter in the Southern Hemisphere — global solar irradiation largely stayed close to long-term averages, with most regions falling within ±8% of typical values. However, several areas diverged significantly from this range.

Heatwaves, wildfires, and an eclipse: three unusual events to report this summer
Best practices

Heatwaves, wildfires, and an eclipse: three unusual events to report this summer

Weather anomalies and extreme events are constantly challenging the results of regular performance reporting on PV assets around the world. This summer, wildfires and heatwaves are affecting large areas of Europe. On top of that, a total solar eclipse, set to happen in just a few days, deserves attention too.