本页未翻译。您正在浏览的是英文版本。

Juraj Beták
Sep 12, 2025
At Solargis, we continuously monitor and analyze unusual patterns in solar resource availability across months, years, and seasons, with global coverage.
During June, July, and August 2025 — corresponding to summer in the Northern Hemisphere and winter in the Southern Hemisphere — global solar irradiation largely stayed close to long-term averages, with most regions falling within ±8% of typical values. However, several areas diverged significantly from this range.
We recorded positive anomalies in East Asia, Southeast Australia, and selected parts of Europe, where solar irradiation exceeded historical norms. In contrast, we observe large deficits across much of India, Nicaragua, and Minnesota (USA), reflecting below-average solar resource availability. These regional differences underscore the heterogeneous nature of solar resource in both time and space.
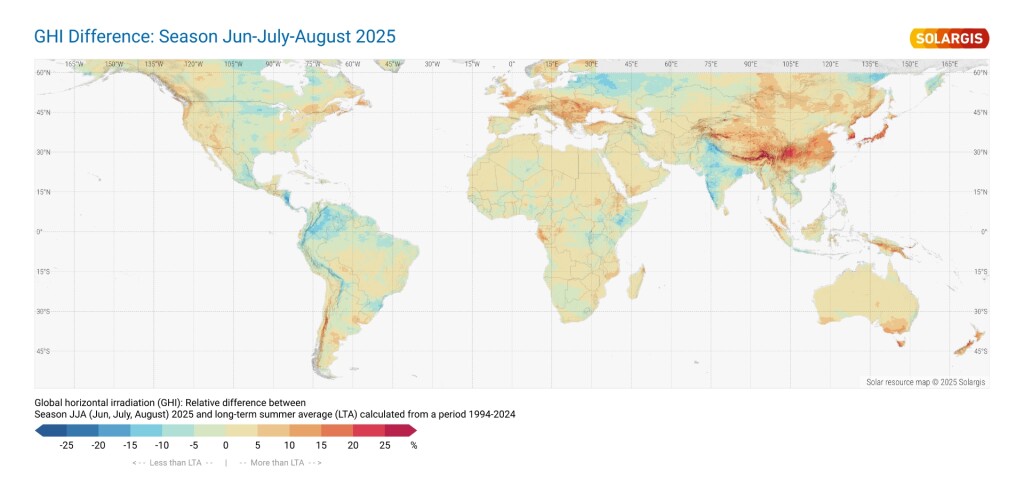
This report presents a global analysis of global horizontal irradiation (GHI) for June-July-August 2025, highlighting deviations from long-term averages.
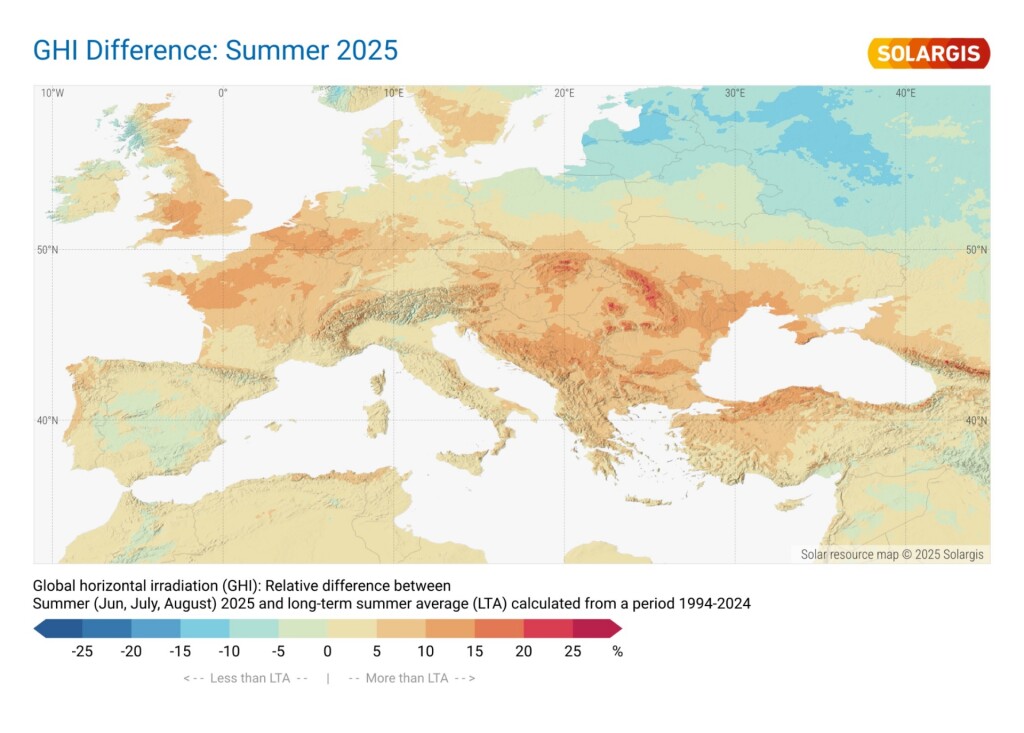
The accompanying maps visualize these anomalies: red indicates higher-than-average GHI, blue marks below-average conditions, while mild orange to green tones represent values near the long-term mean. Such maps are a powerful tool for identifying anomalous regions, offering solar operators, planners, and researchers valuable insights into seasonal variability and its impact on PV performance.
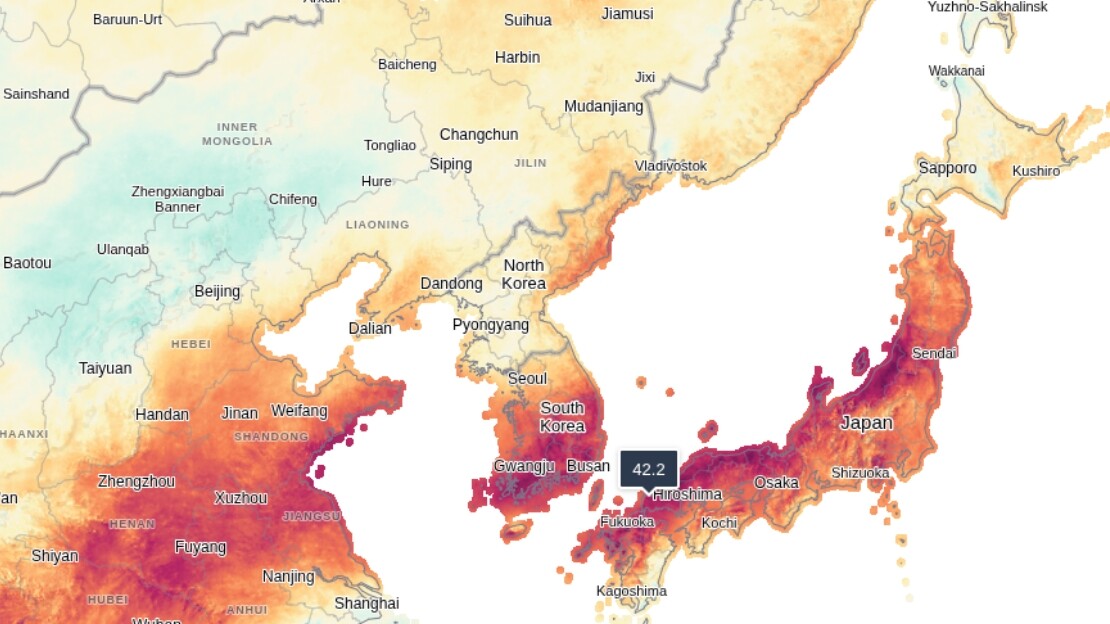
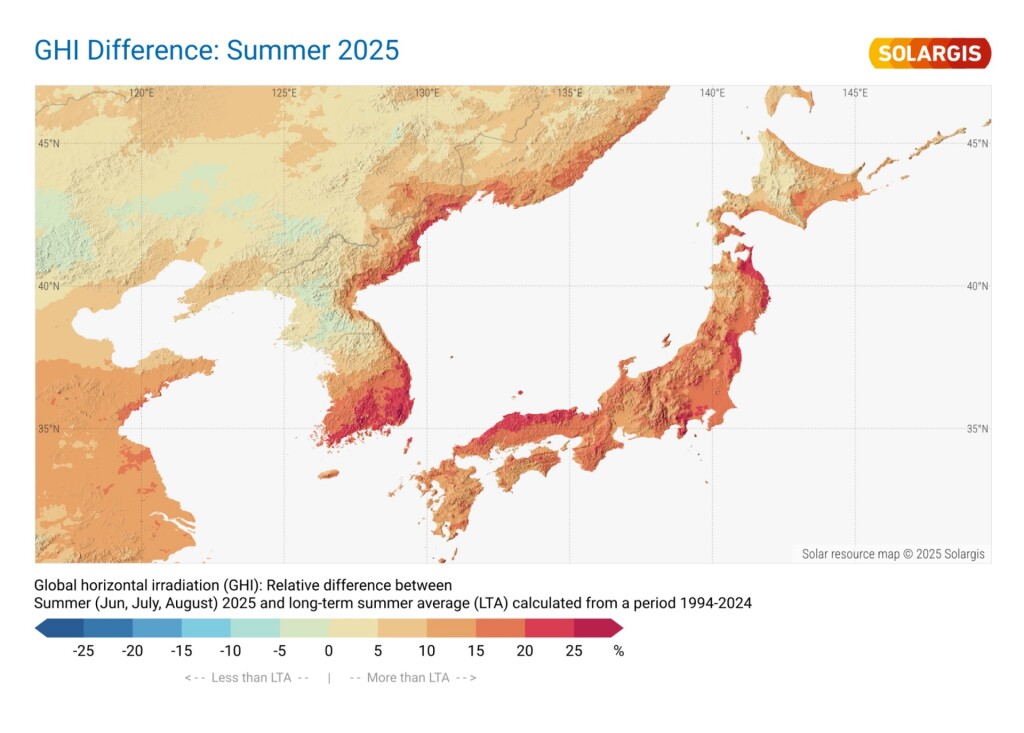
The most anomalous region in summer 2025 was observed across the Japanese islands of Honshu, Kyushu, and Shikoku, as well as the southeastern Korean Peninsula. Solar irradiation reached exceptionally high levels in July, while June and August also recorded positive anomalies, particularly in coastal areas. Overall, the available solar resource in this region was 13% to 22% above the long-term average for summer, with some local areas exceeding 25%.
Read more: Record-breaking July 2025 in Japan: Solar resource +40% above LTA
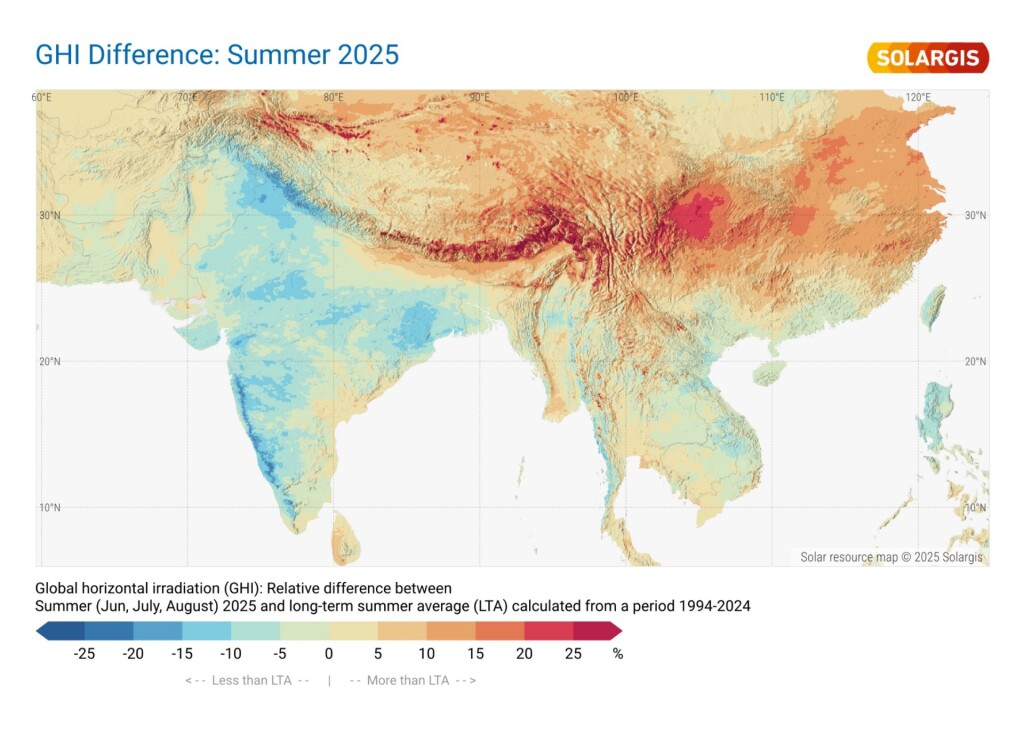
In East China, solar resource conditions during the summer of 2025 were highly variable, with monthly anomalies in global horizontal irradiation (GHI) ranging from deeply negative to extremely positive.
However, when June, July, and August are considered together, overall GHI was above average, typically in the range of +10% to +15%, and locally exceeding +18%. The Sichuan Basin was particularly exceptional, with most areas recording increases of around +20% and central parts surpassing +25%. Solargis data also show that the Sichuan Basin has experienced a remarkable increase in solar resource over the past two years, highlighting the importance of closely monitoring evolving irradiation patterns when planning and operating PV assets.
In 2025, India experienced an above-normal monsoon that arrived early in June and persisted with unusual intensity throughout the season. Compared to previous decades, the monsoon has shown noticeable shifts in its behavior, as highlighted in recent analyses (e.g., this BBC article).
The prolonged monsoon season directly impacted the available solar resource: high atmospheric moisture fueled extensive cloud formation, reducing incoming solar radiation and limiting the potential for PV generation. These conditions highlight the importance of accounting for monsoon variability in solar energy planning and forecasting.
Across most of Europe, the summer of 2025 was characterized by strong month-to-month variability: an exceptionally sunny June was followed by a weak July, while August brought mixed conditions across the continent. When aggregating the three months, two regions stood out with notable positive anomalies: the area around the English Channel (southern UK, northwestern France, and the Benelux countries) and parts of Central and Eastern Europe. Here, GHI exceeded the long-term average by +7% to +14%, with some mountain regions surpassing +20%.
In contrast, the Baltic countries – Estonia, Latvia, and Lithuania – recorded consistently below-average solar resource throughout all three summer months. Deviations in GHI ranged from -6% to -13%, making summer 2025 one of the poorest for solar irradiation in the region in recent decades. Comparable deficits were last observed as far back as in 2000 and 1998.
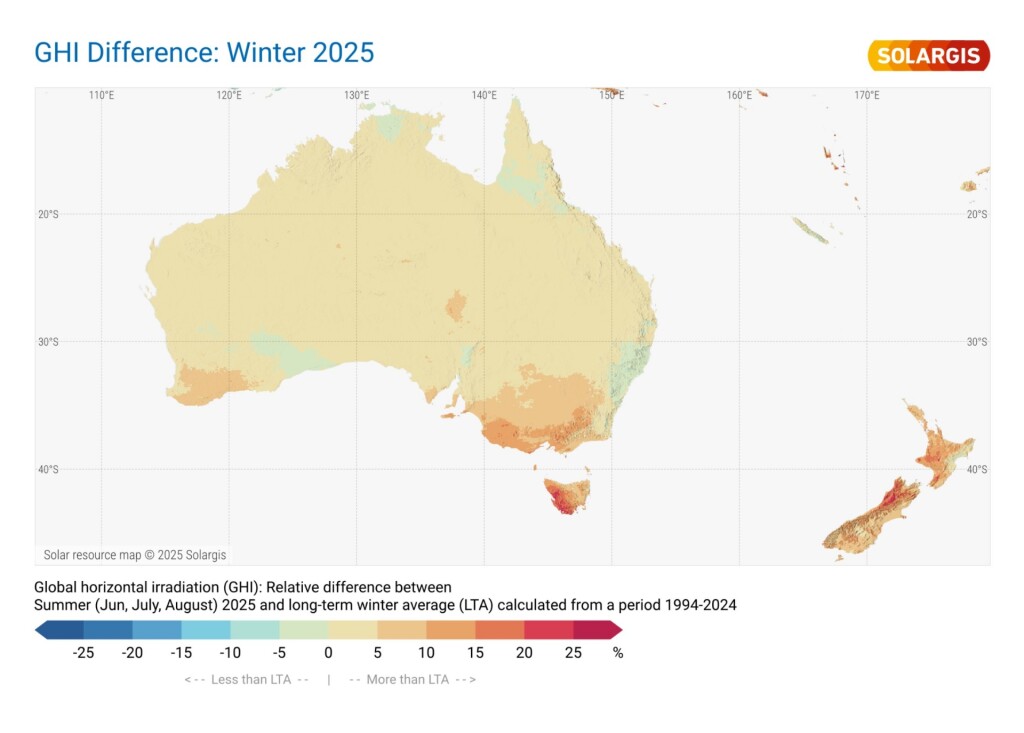
Shifting to the Southern Hemisphere, where June–August corresponds to winter, most of Australia recorded solar resource levels close to the long-term average, generally within -5% to +5%. Southeast Australia and New Zealand, however, showed notable positive deviations, with GHI anomalies of +5% to +15%, and regional hotspots in Tasmania and parts of New Zealand exceeding +20%.
Overall, Australia experienced a warmer-than-average winter in 2025. Notably, these regions have experienced consistently average or above-average GHI over the past 12 months, with very few negative anomalies. This sustained trend has translated into exceptionally strong PV yields, creating favorable conditions for solar operators throughout the year.
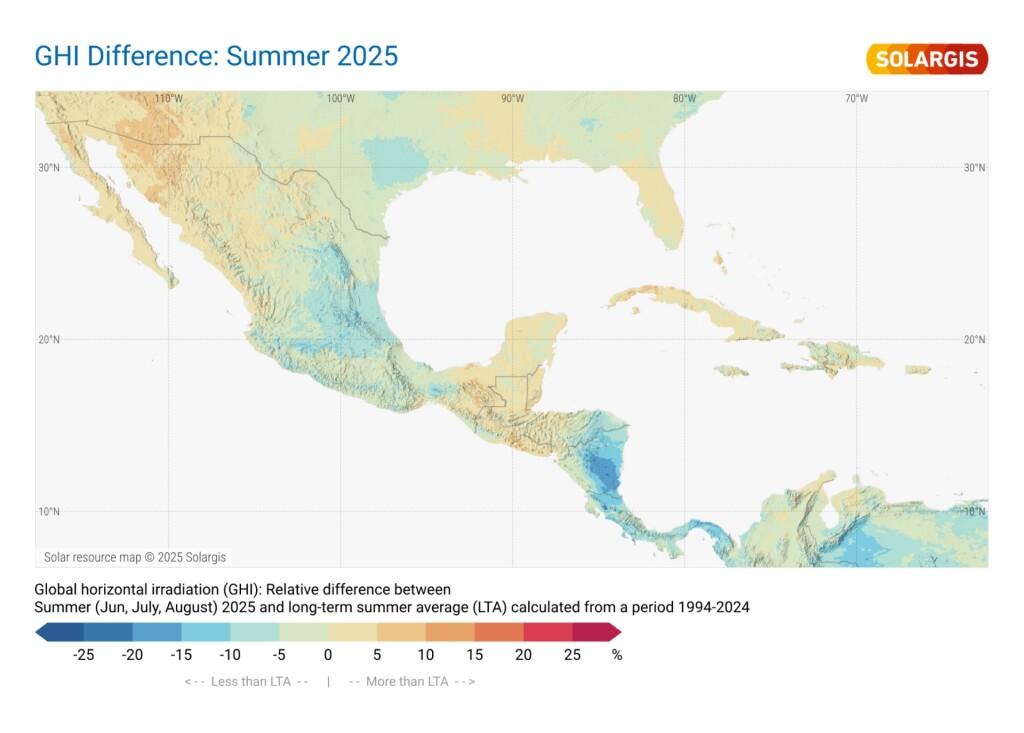
Finally, when examining global patterns, a pronounced negative anomaly emerges in Nicaragua, particularly in the central-eastern region, where GHI fell by up to -20%. This deficit was driven largely by June 2025, which recorded exceptionally low solar irradiation, setting new monthly historical records.
While June typically coincides with the rainy season and elevated humidity, this year was marked by persistent cloud cover and significantly above-average precipitation of 400–700 mm – often double the long-term average, with some locations reaching absolute monthly records.
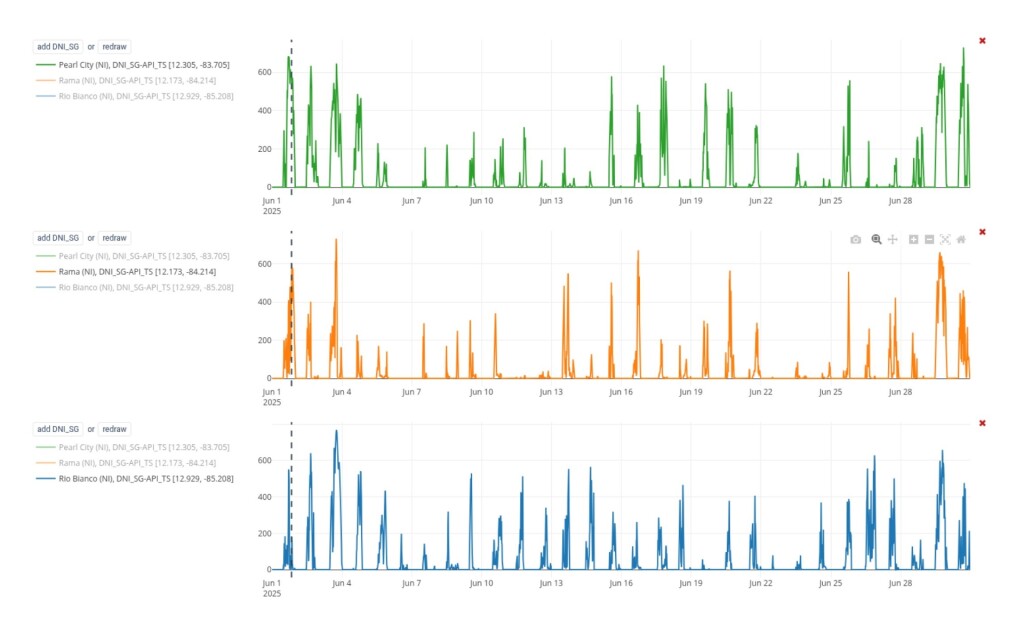
In the charts below, the analysis of Solargis 10-minute time-series data for direct normal irradiance (DNI) at three representative sites reveals 10–15 heavily overcast days during the month, with most of the remaining days only partly cloudy. Notably, large-scale atmospheric indices such as ENSO and MJO were close to neutral, indicating that the prolonged cloudiness was primarily a local phenomenon rather than the result of broader climatic oscillations.
The anomalous cases described above underscore the importance of continuously monitoring and evaluating solar resource variability on operational, monthly, and seasonal timescales.
For the PV industry, understanding these fluctuations is critical to setting accurate energy yield expectations and optimizing asset management. Seasonal anomalies — whether positive or negative — can significantly influence revenue projections and operational strategies. By leveraging high-resolution solar irradiation datasets and time-series analysis, solar operators can better anticipate variability, adapt to local weather patterns, and improve both the reliability and profitability of PV installations across diverse geographic regions.