本页未翻译。您正在浏览的是英文版本。
The global rise in extreme weather events and natural catastrophes has become one of the most pressing challenges for the solar industry today.
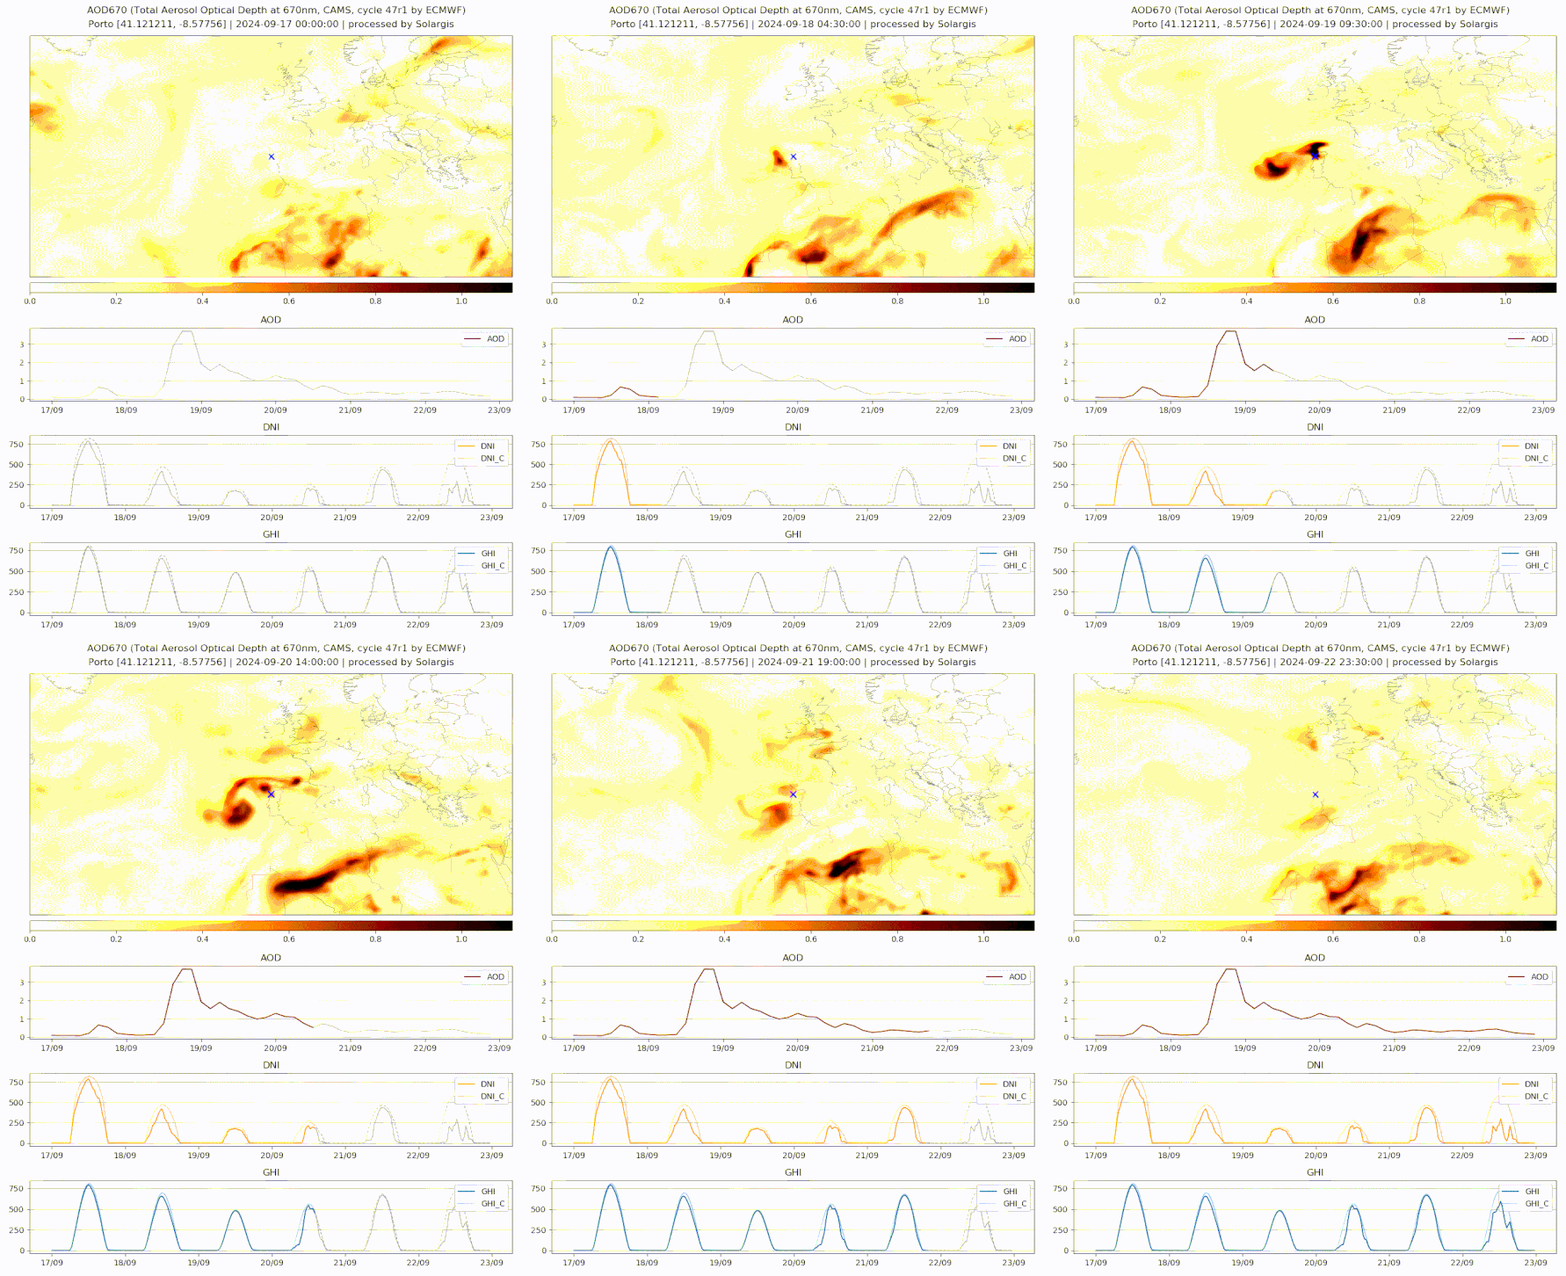
We've seen an increase in major loss events affecting solar projects worldwide. Extreme weather causing high cloud cover and atmospheric pollution by aerosols can impact the ability of solar power plants to generate energy. For instance, in September 2024 we observed the effects of forest fires in Portugal, where ashes from the fires caused a temporary GHI reduction of up to 30%, subsequently followed by increased PV module soiling.
The animation below shows the impact of ashes from these forest fires with clear-sky global horizontal irradiance (GHIc) dropping by 30% between 19 and 20 September 2024.

We also witnessed extreme weather taking a toll on the photovoltaic module fields, causing significant material damage.
In October 2024, a tornado tore through and significantly damaged the 45-megawatt Lake Placid Solar Power Plant in Highlands County, Florida, just before Hurricane Milton hit. Several typhoons in the South China Sea have recently posed similar challenges to local solar power plants.
The higher frequency of the extreme weather puts growing pressure on the PV industry to design power plants that can withstand harsher conditions. Beyond this, developers must consider the potential losses from the extreme weather events and the likelihood of their occurrence.
Lenders and insurance companies have responded to this reality with more demanding requirements and stringent policies. Policyholders in the renewable energy insurance market are paying between 20%-40% more for cover today than a year ago as insurers seek to recover the cost of solar energy losses in regions hit by natural catastrophes.
The stricter standards and policies can, overall, jeopardize the financial feasibility of PV projects, and failure to meet them can even result in outright denial of coverage.
However, the financial implications don’t end there. Costs associated with repairing or replacing damaged equipment can accumulate quickly. For solar projects to remain profitable, consistent energy production is essential. When actual performance falls short due to physical stress, damage, or inadequate design, the economic viability of projects comes into question – deterring investment and slowing the overall growth in the sector.
A key challenge faced by developers lies in the limitations of the solar evaluation software currently available on the market. Most of the tools rely on hourly Typical Meteorological Year (TMY) data. While TMY aggregates data from previous years into a 'typical' year, capturing typical weather patterns, it falls short in accounting for weather variability and extreme events. The lack of granularity and insufficient historical depth of data means that PV designs based on TMY simulations lack information about “non-typical” events.
This disconnect between simulation and reality highlights the urgent need for technology capable of performing PV simulations with more granular datasets. Time series data, with 15-minute granularity offer opportunity for more detailed and accurate performance evaluation.
High-resolution time series data is a significantly better alternative to TMY, not only for addressing extreme weather and variability but also for improving the overall accuracy and reliability of PV simulation.
Compared to TMY, 15-minute time series data considers each actual year over the past, for example, 30 years. Each year is broken down into 15-minute intervals, offering data at an unprecedented level of detail for more reliable energy yield simulations and more flexible business models.

The reason why current software solutions don't provide this level of data granularity is simple – the limitation of data that simulation software can process.
Since TMY is the standard, most simulators are designed to handle a maximum of 8,760 data values, corresponding to the number of hours in a year.
At Solargis, we believe it is time to move beyond outdated concepts. In January 2025, we have launched Solargis Evaluate 2.0 that by default uses 15-minute time series data spanning up to 30 years of historical records. This high-resolution data approach ensures PV simulations that encompass both typical and extreme weather scenarios.
When hourly TMY data equals 8,760 data values for yield simulation, Evaluate 2.0 simulates 30 years in 15-minute intervals—resulting in 30 x 8,760 x 4 = 1,051,200 data values per parameter. That’s 120 times more data on the inputs than the current standard.

By incorporating environmental parameters, such as air temperature, wind speed and wind gust, humidity, soiling, snow, precipitation, and albedo, Solargis Evaluate 2.0 offers a comprehensive and nuanced analysis of PV power plant performance.

The new Solargis Evaluate also ensures that both short-term and long-term variability are considered. This level of detail is critical for optimizing PV power plant design to ensure predictable and sustainable energy delivery. Moreover, it mitigates weather-related risks, enhancing the resilience of PV projects against extremes.
By harnessing high-resolution data and sophisticated simulation capabilities, Solargis Evaluate 2.0 offers the most robust solution for PV performance evaluation in the market, supporting financial estimates and contributing to the sustainable growth of PV projects in an increasingly challenging climate.