When we introduced Solargis Evaluate 2.0 last year, our goal was clear: to bring high-quality solar data, PV design, and energy yield simulation into a single modern platform that reflects how PV engineers and developers really work.
Solargis Evaluate integrates:
Twelve months have passed since launching the platform and we’ve delivered numerous product updates that make Evaluate an even more powerful solution for complete PV project design and evaluation. In this article, we’ll walk you through the most important updates and new features.
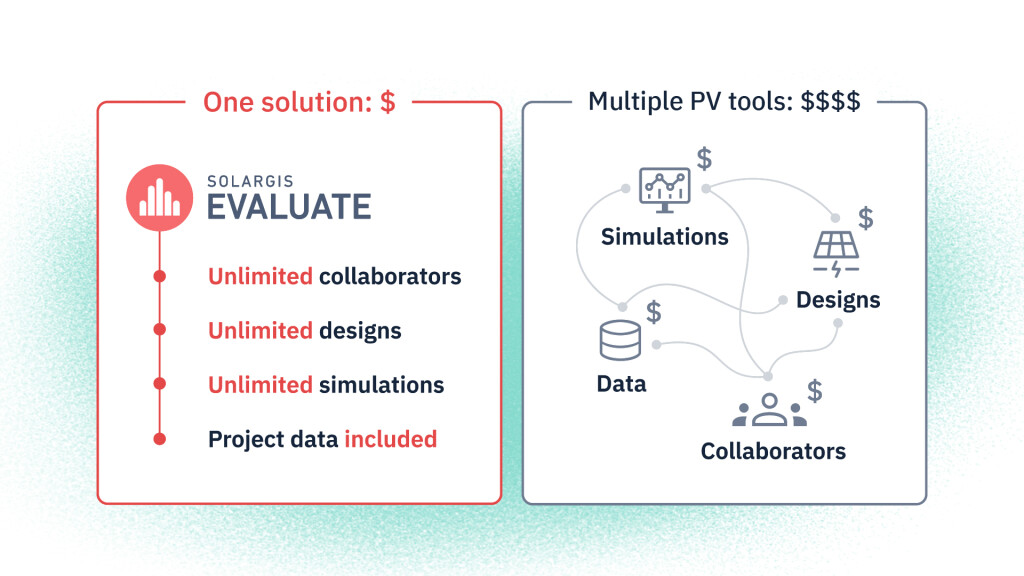
One of the most visible changes is not in the interface, but in the business model. We’ve had dozens of conversations with users about how they really want to work: with more streamlined workflows, fewer tools, and less friction between data, PV design, and simulation. And we listened.
Enjoy the most accurate data from the very first moment of project development, without having to move the data back and forth between tools for design, PV simulation, and data analysis. Evaluate lets you keep everything in one place.
A €12,000/year Solargis Evaluate subscription now includes:
You can now run as many 15-minute TMY P50 simulations as you need, without worrying about “using up” your subscription or optimizing your license limits. If you want to compare multiple layouts, DC/AC ratios, technology options, or design revisions, you can simply do it at no additional cost.
Many new utility-scale PV projects are not built on perfectly flat desert plots. They sit on rolling terrain, sloped agricultural land or irregular parcels constrained by land availability. Early designs need to reflect that reality to mitigate risks associated with erosion, ground disturbances and construction.
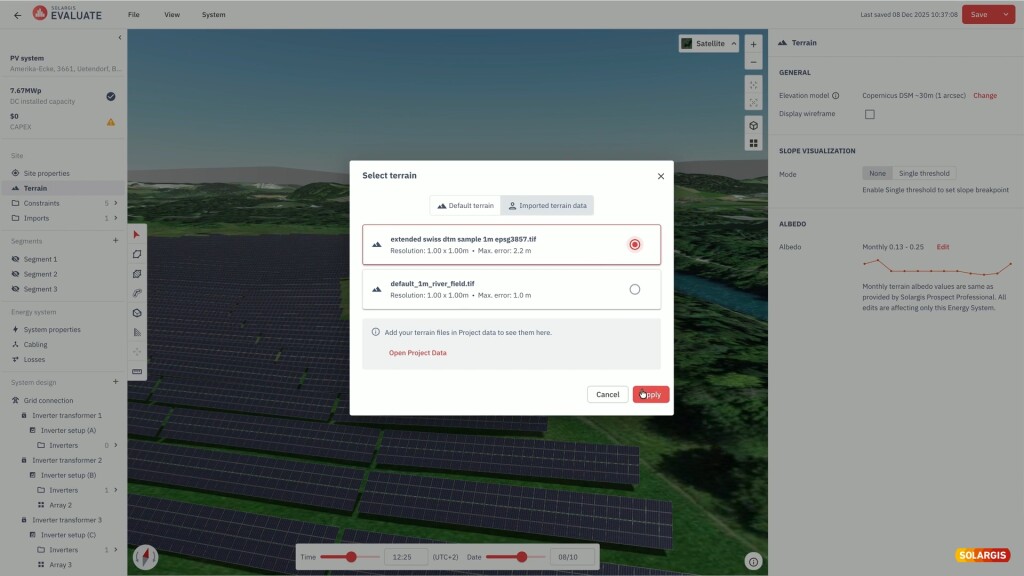
Over the past year, we introduced terrain-following PV design in the 3D Energy System Designer. The PV simulation is performed at the cell level, ensuring precise inter-row shading accuracy even on irregular terrain. You can now:
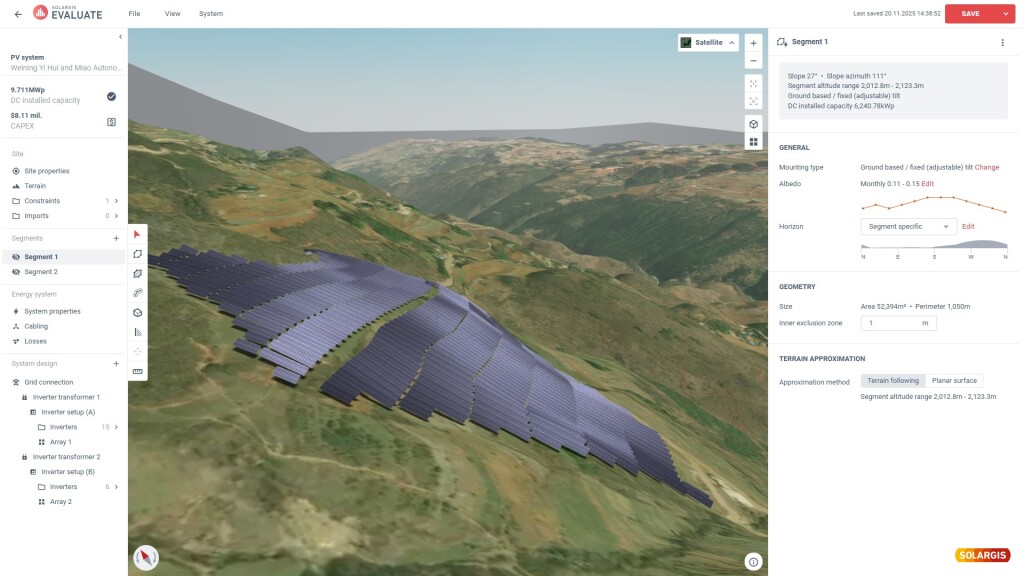
You can also upload up to 5 of your own terrain data in GeoTIFF format. This allows you to override default global or regional DEMs with high-resolution, project-specific data, so your row heights, inter-row spacing and shading calculations are based on the terrain you will actually build on, not a smoothed global model.
These features make early-stage layouts far more representative of the real site, reducing uncertainty, the risk of later redesigns and making energy yield simulations more reliable.
Estimating total project cost is as important as estimating energy yield. To compare options properly, you need to understand how design decisions affect CAPEX.
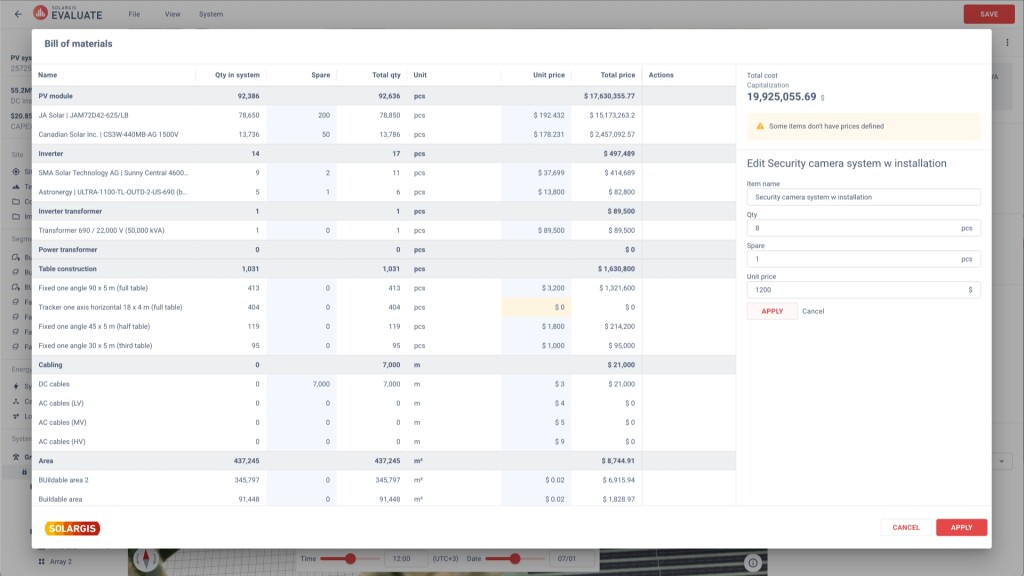
That’s why we added an interactive bill of materials that estimates project costs as you design. While working on the layout, you can assign unit prices and spare quantities to individual components and watch totals update in real time, with the total CAPEX always visible to reflect the cost impact of design decisions.
You can add custom items that are not part of the predefined library, so the estimate better reflects your actual project scope. Instead of exporting layouts to spreadsheets and stitching everything together by hand, you see both performance and indicative cost in one place, while you are still exploring design options.
Accounting for snow and soiling losses has a direct impact on the forecasted energy production. Ignoring them, or assuming a generic fixed loss, can easily result in overly-optimistic PV simulations.
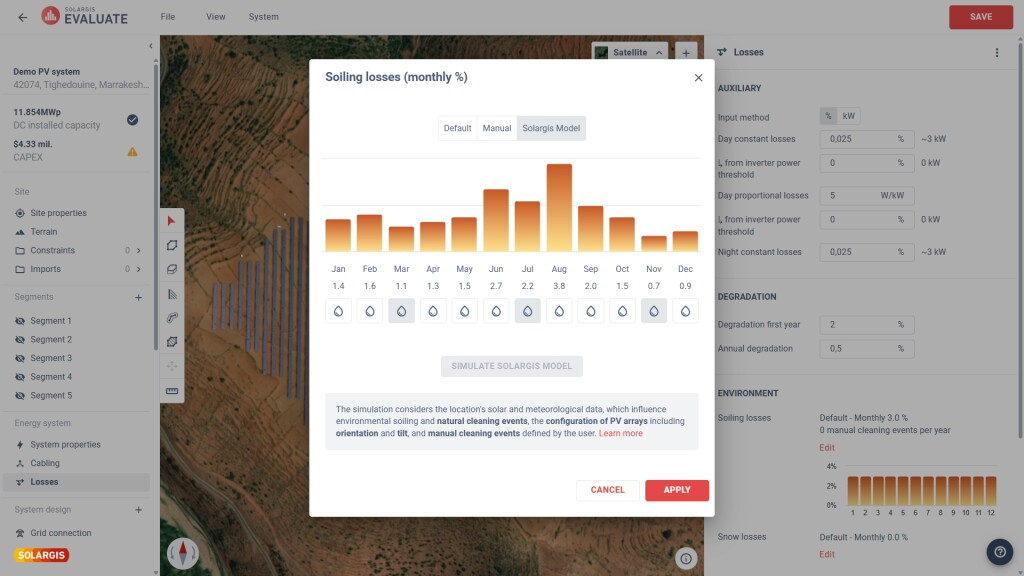
Evaluate now lets you simulate both snow and soiling losses using Solargis models built on high-resolution solar resource and meteorological data. The models account for:
You can define your own cleaning schedule based on your planned maintenance schedule or use the simulation results to identify periods where cleaning is most impactful and plan events accordingly. These losses are then consistently integrated into the energy yield chain, making bankable reports more realistic and reducing the risk of unpleasant surprises in operation.
Regardless of how optimistically the energy yield predictions look, a project cannot be financed on promises alone. Probabilistic scenarios are essential for bankability, as most lenders require P50 for expected performance and P90 (or P95) for debt service coverage calculations.
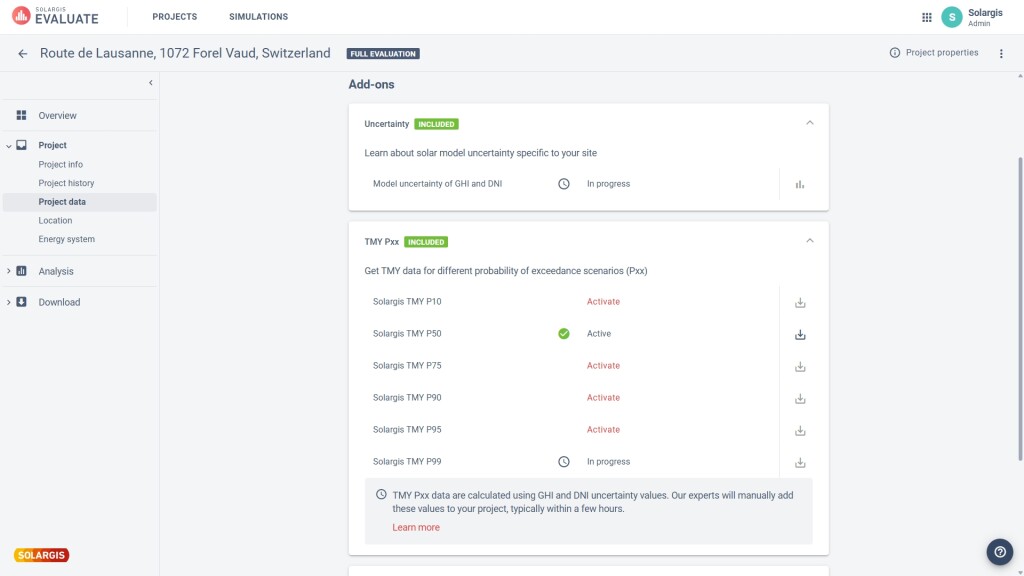
In the past year, we’ve integrated uncertainty estimates and Pxx values directly into Evaluate. You can now request GHI and DNI uncertainty for your project and obtain P10, P50, P75, P90, P95 and P99 values based on the Solargis model’s performance in your region, and interannual variability derived from the long-term historical record.
Evaluate now provides these values consistently for each project, so you can:
Short-term variability matters more than ever for DC/AC sizing, grid compliance, storage and ramp-rate control. To support this in Evaluate, you can now request, export, and run a PV simulation using 1-minute TMY P50 data.
Considering high-resolution 1-min data from the initial design phase is essential for achieving higher accuracy in performance forecasts, optimizing system configuration for local conditions, and maintaining compliance with evolving technical and grid requirements.
Compared to 15-minute or hourly data, 1-minute resolution:
The result is more robust, efficient, and bankable solar power projects and a closer match between simulated and real-world operation, particularly for projects in highly variable climates or with tight grid requirements.
Because Evaluate is cloud-based, collaboration allows multiple stakeholders to access the same project, assumptions, and results in real time. It aligns all stakeholders on project progress and leads to a more coordinated decision-making across geographically distributed teams.
We have introduced a new project collaboration manager. You can allow other users from your company account to view your projects (read-only access) and you can transfer the ownership of the project, so that the owner can edit the project.
In parallel, we’ve made a steady stream of smaller improvements across the Analysis and Reports sections. These include:
Other improvements related to Exports:
We will keep listening to your feedback and improving the platform continuously so stay tuned because we already have plenty of new product updates in the pipeline.
If you’re already using Solargis Prospect, Evaluate is the natural next step. If you’re new to Solargis, it’s a way to bring high-quality solar data, modern PV design and robust simulation into one coherent workflow.
If you’d like to explore Evaluate for your own projects, contact us and our team will be happy to walk you through the platform.