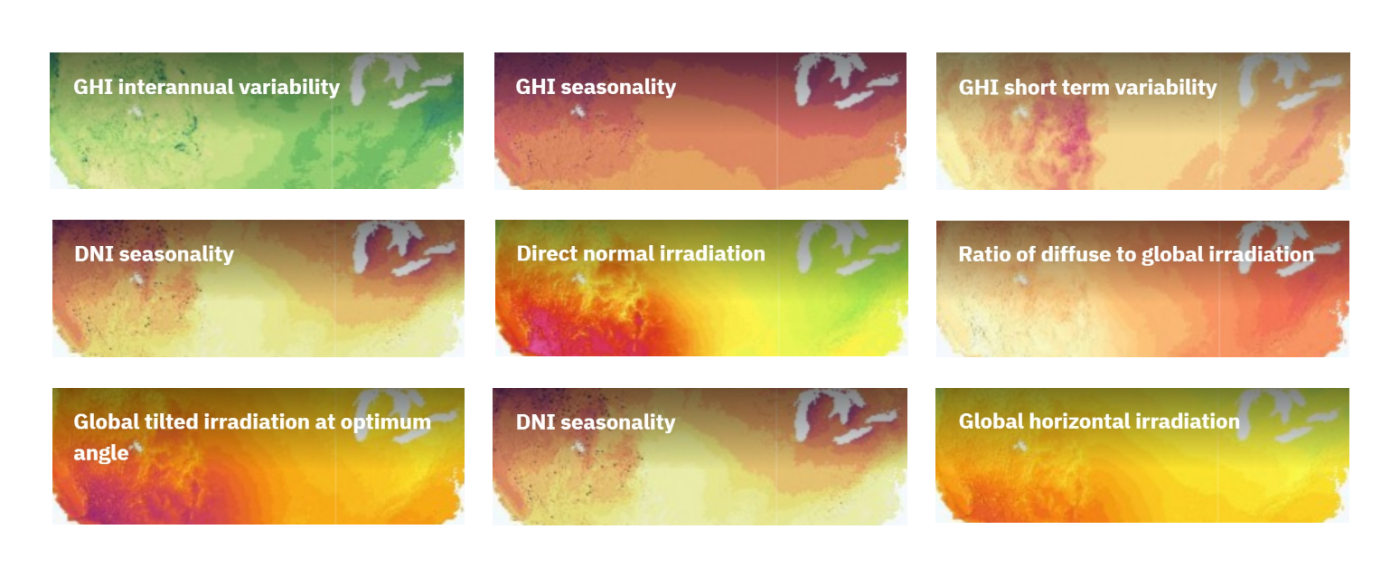
Productos
menu item
Prospect
Estimación rápida del potencial solar del emplazamiento fotovoltaico
menu item
Evaluate
Series temporales y datos TMY para modelización energética
menu item
Monitor
Evaluación de la producción fotovoltaica en tiempo real
menu item
Forecast
Previsión de la producción de energía solar para hasta 14 días
menu item
Analyst
Gestión de datos solares simplificada y unificada
menu item
Integraciones
Automatice la entrega de datos Solargis
Casos de uso
menu item
Selección de emplazamientos
Encuentre la ubicación adecuada para su proyecto solar
menu item
Simulación de la producción de energía
Analice los beneficios y riesgos potenciales
menu item
Optimización del diseño de plantas de generación eléctrica
Encuentre el diseño óptimo de la central eléctrica
menu item
Rendimiento real de plantas de generación eléctrica
Conozca la verdadera producción eléctrica
menu item
Predicción de generación
Obtenga predicciones de la producción de energía del proyecto solar
menu item
Verificación de datos de tierra
Verifique la calidad de las mediciones solares y meteorológicas
Evaluación de recursos solares y meteorología
Validación y evaluación detallada del recurso solar
Adaptación al sitio de modelos Solargis
Combinación de datos de satélite con mediciones de tierra
Control de calidad de mediciones solares y meteorológicas
Corrección de errores en los datos medidos en tierra
Datos SIG personalizados
Datos SIG de Solargis personalizados para sus aplicaciones
Evaluación de la producción de energía fotovoltaica
Estimación de incertidumbres de energía y datos de entrada relacionados
Evaluación del rendimiento fotovoltaico
Estimación de energía para refinanciación o adquisición de activos
Estudio de variabilidad fotovoltaica y optimización de almacenamiento
Comprensión de la variabilidad de la producción en amplias regiones geográficas
Estudio del potencial regional de energía solar
Identificación de ubicaciones para plantas de energía solar
Nuestra experiencia y conocimientos
Cómo funciona nuestra tecnología
Metodología
Cómo transformamos la ciencia en tecnología
API e integración
Cómo integrar los datos de Solargis mediante API
Guías de productos y documentación
Notas de la versión
Casos de éxito
Blog
Ebooks
Seminarios web
Publicaciones
Eventos
Mapas y datos GIS gratuitos
Mapas de rendimiento solar
Acerca de Solargis
Socios
Certificación ISO
Empleo

Esta página aún no está traducida al español. Puede verla sólo en inglés.

Automatically updated global solar database of long-term monthly values#

Use one reliable database for preliminary analysis of solar energy opportunities for sites all around the globe.

Beyond looking at annual data, understanding solar irradiation seasonality is important for choosing the right technology for your PV project. 

To see differences over the year, Prospect provides averaged irradiance values for each month. These values are derived from globally validated Solargis satellite models.

See all parameters ->

GHI+DIF

With Prospect's 24x12 daily profiles, you'll see how solar irradiation averages change depending on the time of the day.

GHI+DNI+DIF

Understand the expected average working conditions of the power plant to estimate related thermal, spectral, and snow losses, as well as other effects of the environment on the energy conversion.

Besides solar irradiation parameters, Prospect gives you averaged hourly temperature and monthly values for wind, humidity, precipitation, snow, and others. 

See all parameters ->

Meteo parameters

To accurately calculate the reflected solar irradiance, you need site-specific averaged monthly albedo data. This is especially important for bifacial modules.

Read our whitepapers about Albedo ->

Ground albedo values

Surface slope, azimuth, and horizon data are available in Prospect as well.

You want to know these values for improved incident irradiance and far shading loss calculations. We use digital surface models to help identify local features and their effect on solar energy at the pre-feasibility stage when detailed site information is not available.

Terrain data a

Besides in-app data visualizations and summary reports, you can download solar irradiance and meteo data in CSV format. The format is especially useful if you want to import the data into other energy simulation tools.

See file samples ->

Prospect updates and recalculates yield values automatically after each additional year of data is collected. To help you work with the most representative averages every time a new year is complete, we automatically add it to the app.

You can also keep the calculations done using older data and recalculate using updated data any time you want.

High-resolution solar resource maps#

Check how solar energy averages and key meteorological parameters change throughout the year in collecting locations and regions of interest. 

During the site prospection, you can visualize solar irradiation maps in high resolution: global irradiation, direct irradiation, diffuse to global fraction, and irradiation seasonality.

Thanks to energy conversion algorithms, we have also created global tilted irritation and expected energy yield maps.

See all map layers ->

Geodata layers

As a Prospect user, you can explore the site's meteorological conditions by switching between air temperature, lowest expected operating temperature, wind speed, precipitation (rainfall), snow days, relative humidity, and precipitable water data layers.

See all map layers ->

Meteo geodata layers

Access map visualizations of important local data: ground albedo, land cover, elevation, terrain slope, and azimuth. 

Besides, other factors related to energy demand provide additional contextual information for your energy projects, e.g. population density, cooling, and heating degree days. To help with local explorations, maps including topographic names and satellite views are also included.

See all map layers ->

Other geodata layers

The Prospect's map interface allows for measuring the distance between sites and calculating areas by simply drawing them on the map without needing any additional GIS tool.

Distance surface calc

By pinning your project on the Prospect's map, you will have quick access to all project details and the option to share the location with other team members.

Interactive markers

User-friendly and reliable system configurator#

Run quick simulations for your chosen PV technology and let other project team members easily replicate and check expected energy yield values.

Run simulations for ground-mounted PV systems for any azimuth and tilt.
Prospect’s simulation engine can also simulate energy yield for the most common tracking systems.


Ground and tracker

Prospect can simulate PV systems taking into account specific characteristics of rooftop PV installed on flat or inclined roofs (or even vertically oriented systems).

Roof large tilted

Calculate the expected yield for floating PV systems thanks to our specific simulation model.

Floating PV

Using the most common settings users can save time and generate results faster. Besides, this feature makes it simple to retrieve results even for those without an engineering background.

Syst setings

Users can predefine their preferred PV system with some specific details so that they save time and foster the consistency of solar projects across their portfolio.

Prospect facilitates exporting any project configuration in CSV format. This is useful for using the same settings in a Solargis API call at a later stage. It is also a simple way to share your project configuration with other team members and stakeholders.

Pre-feasibility reports in just a few clicks#

Run quick reports and comparisons of long-term expected values for your future PV project. Prospect allows you to keep track of all your solar energy opportunities and share them with the project stakeholders.

Prospect integrates all the insights to help you better analyze project opportunities.

This includes expected energy yield during the PV plant’s lifetime together with an overview of solar irradiation and climatic conditions for the specific project location.

System overview2

Prospect calculates the expected energy using the Solargis simulation engine. 

As a result, you will get tables and charts visualizing the expected energy generation and performance ratios for each year of the PV plant’s lifetime.

PV performance2

With 24x12 daily profiles provided in Prospect, you will know how energy averages change depending on the time of the day.

This is especially useful for projects where meeting certain demand requirements is important.

PVOUT total

Prospect provides an overview of site-specific environmental conditions in a comprehensive summary of long-term averages of irradiance and other key parameters.

This allows for further calculation of related thermal losses (temperature, wind), spectral losses (humidity, precipitable water), soiling losses (precipitation rates), and snow losses (snow days).

For the estimation of reflected irradiation from the ground surface, ground albedo values are also included.

Site enviro conditions V2

Terrain data and sun path diagrams will help you understand how the sun's position and surrounding mountains impact the energy received by the system throughout the year.

Terrain data a

Check energy losses across the whole energy conversion process.

For the calculation, the software considers all steps on the energy conversion chain: far shading, soiling, snow, angular reflectivity,  spectral loss, module’s PV conversion, inter-row shading, module’s power tolerance, inverter efficiency, and electrical losses related to mismatch, cabling, and other losses on the AC side of the system.

Loss diagram

Generate, download, and share reports in PDF and XLSX formats.

You can choose your preferred unit configuration and language (more than 15 are available) and keep track of all the generated reports for each of your solar energy projects.

Download report sample ->

Reports

Solargis Prospect allows users to work on their preferred geographical and physical units e.g. solar radiation, temperature, latitude and longitude, and terrain. For numbers shown in the finance section, users can also choose from the most popular currency units.

Unit settings

Prefeasibility finance calculator#

Have a first approximation of your PV project's return on investment. Besides expected energy values, Solargis Prospect has built-in features to calculate other financial indicators.

Prospect calculates the expected project revenue for the entire power plant’s lifetime.

Cash flow

Prospect's finance calculator allows inserting main PV system costs for both installation and regular operations. 

Capex and opex

Besides your inputs on the price of electricity, Prospect takes into account also tax rates and debt ratio when calculating project finances.

Loan interest taxes

Project comparison and management#

Compare your projects and have them always organized. Solargis Prospect offers a useful set of features that will help you save time when prospecting for new opportunities.

During the prospection phase, it's natural that you want to compare several project options. Prospect's comparison feature instantly shows yield and climate conditions for multiple projects at the same time, without the need to extract or import any data.

Compare projects

Prospect not only helps save time on data collection and energy calculation tasks. It also helps keep all user's projects organized with additional features for naming, adding labels, and archiving projects.

Project organizer

To facilitate working across team members, users can change the ownership of the project to other users that are included in the same company subscription.