


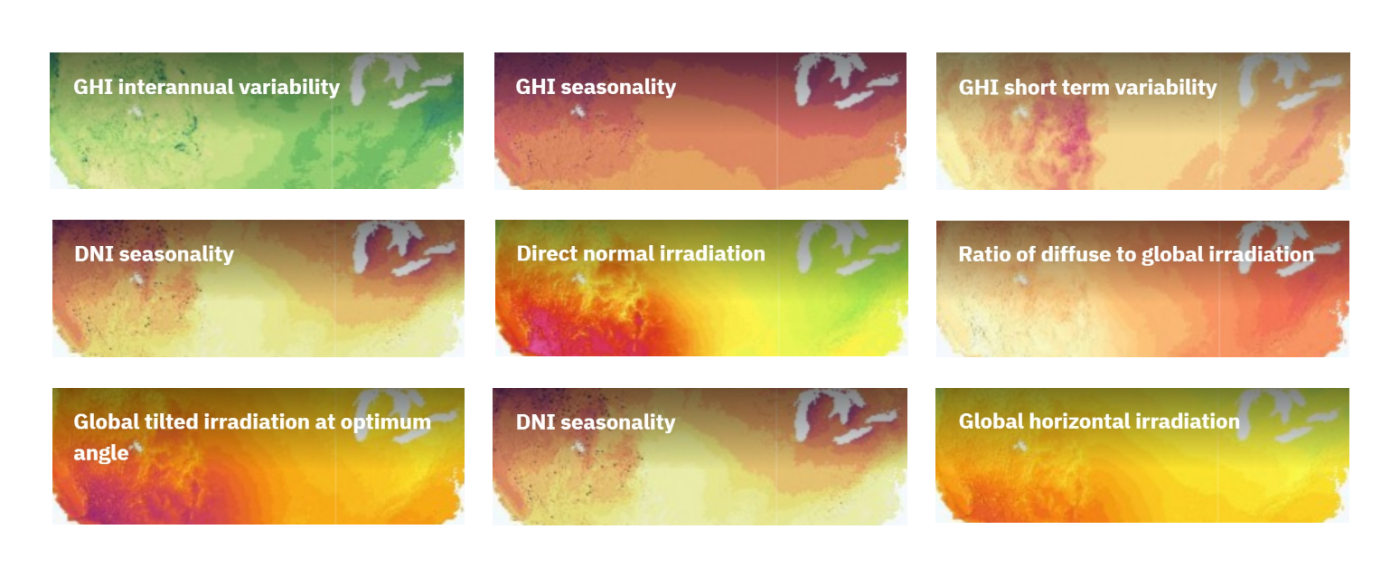
除了查看年度数据外,了解太阳辐照的季节性对于选择适合您的光伏项目的技术也很重要。
为了了解全年辐射的变化,Prospect 提供了每个月的平均辐照度值。这些值来自全球验证的 Solargis 卫星模型。
[查看所有参数 →]
除了查看年度数据外,了解太阳辐照的季节性对于选择适合您的光伏项目的技术也很重要。
为了了解全年辐射的变化,Prospect 提供了每个月的平均辐照度值。这些值来自全球验证的 Solargis 卫星模型。
[查看所有参数 →]

通过 Prospect 的 24x12 日剖面图,您将看到太阳平均辐照度如何随一天中的不同时间而变化。

了解发电厂的预期平均工作条件,以估算相关的热损失、光谱损失和雪损失,以及环境对能量转换的其他影响。
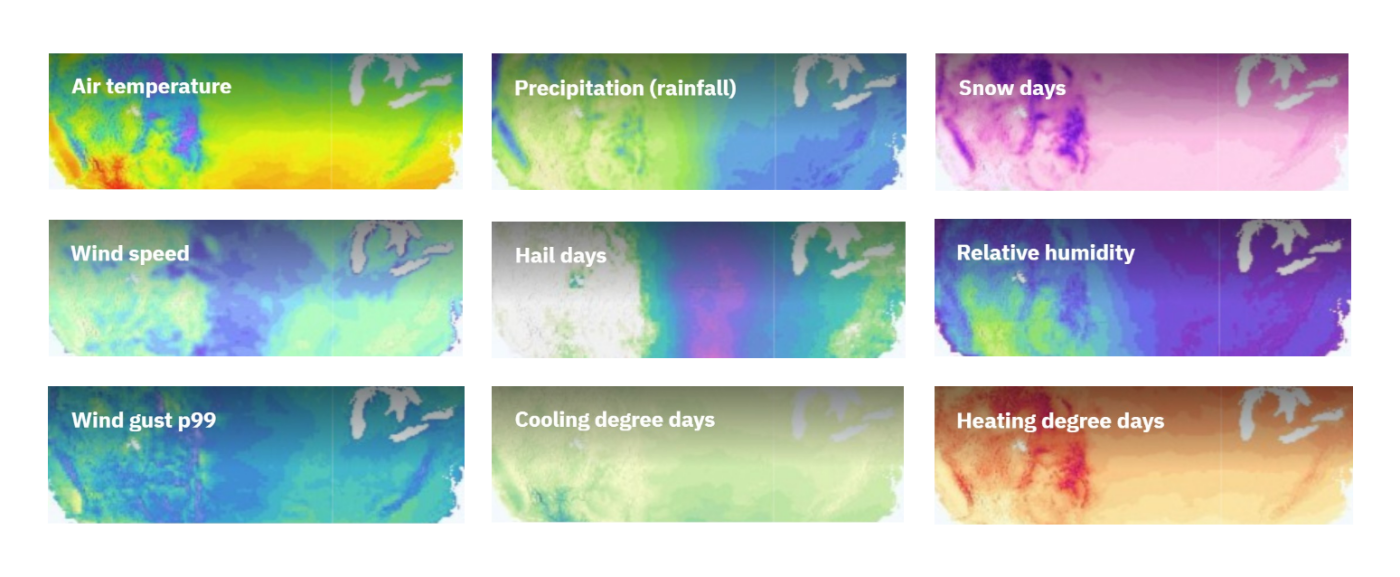
除太阳辐照参数外,Prospect 还可提供每小时平均温度和每月风、湿度、降水、雪等参数值。

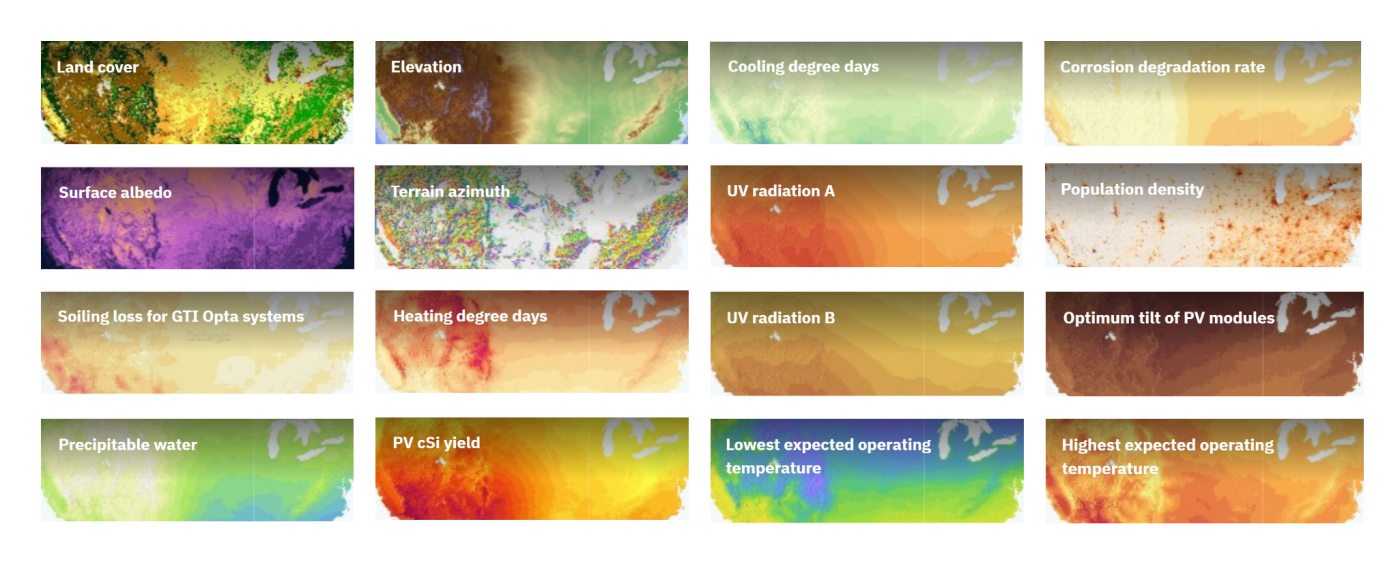
要准确计算反射太阳辐照度,需要特定地点的月平均反照率数据。这对于双面组件尤为重要。

Prospect 中还提供地表坡度、方位角和地平线数据。
您需要了解这些值,以改进入射辐照度和远遮阳损失计算。在预可行性研究阶段,如果没有详细的场地信息,我们会使用数字地表模型来帮助识别当地特征及其对太阳能的影响。

除了应用程序内的数据可视化和汇总报告,您还可以下载 CSV 格式的太阳辐照度和气象数据。如果您想将数据导入其他能源模拟工具,这种格式尤其有用。
每多收集一年数据,Prospect 就会自动更新并重新计算产量值。为了帮助您使用最具代表性的平均值,每完成一个新年度,我们都会自动将其添加到应用程序中。
您还可以保留使用旧数据进行的计算,并随时使用更新的数据重新计算。
作为 Prospect 的用户,您可以通过在气温、降水(降雨量)、降雪天数、风速、可降水、冰雹天数 、 相对 湿度等 数据图层 之间 切换,探索该地区的气候状况 。
查看重要本地数据的可视化地图:地表反照率、土地覆盖、海拔、地形坡度及方位角。
此外,与能源需求相关的其他因素可为您的能源项目提供额外的背景信息,例如人口密度、腐蚀劣化率、UVA、UVB、预期最低和最高运行温度以及更多数据图层。
为协助开展本地勘察,地图中还包含地形名称和卫星视图。
Prospect 的地图界面可以测量站点之间的距离,只需在地图上绘制即可计算面积,无需任何其他 GIS 工具。

通过将您的项目固定在 Prospect 的地图上,您可以快速访问所有项目详情,并选择与其他团队成员共享位置。

Prospect 的模拟引擎还能模拟最常见跟踪系统的发电量。
Prospect 可以模拟光伏系统,并考虑到安装在平顶或倾斜屋顶上的屋顶光伏系统(甚至是垂直方向的系统)的具体特点。

利用我们的特定模拟模型,计算浮动光伏系统的预期收益。

使用最常用的设置,用户可以节省时间并更快地生成结果。此外,即使没有工程背景的人也能通过这一功能简单地检索结果。

用户可以预先确定自己喜欢的光伏系统的一些具体细节,从而节省时间,并促进整个太阳能项目组合的一致性。
Prospect 方便以 CSV 格式导出任何项目配置。这对以后在 Solargis API 调用中使用相同的设置非常有用。这也是与其他团队成员和利益相关者共享项目配置的一种简单方式。
Prospect 整合了所有见解,帮助您更好地分析项目机会。
其中包括光伏电站寿命期内的预期发电量,以及特定项目地点的太阳辐照和气候条件概览。

Prospect 使用 Solargis 仿真引擎计算预期能量。
因此,您将获得表格和图表,直观显示光伏电站寿命期内每年的预期发电量和性能比。

通过 Prospect 中提供的 24x12 日剖面图,您可以了解能源平均值在一天中不同时间的变化情况。
这对满足特定需求要求的项目尤其有用。

通过对辐照度和其他关键参数的长期平均值进行综合汇总,Prospect 可提供特定地点的环境条件概览。
这样就可以进一步计算相关的热损失(温度、风)、光谱损失(湿度、可降水量)、污损(降水率)和雪损(雪日)。
为估算地表反射辐照,还包括地面反照率值。

地形数据和太阳路径图将帮助您了解太阳位置和周围山脉对系统全年接收能量的影响。
检查整个能量转换过程中的能量损失。
在计算时,软件会考虑能量转换链上的所有步骤:远距离遮阳、污垢、积雪、角度反射率、光谱损耗、组件的光伏转换、行间遮阳、组件的功率容差、逆变器效率,以及与错配、布线有关的电气损耗和系统交流侧的其他损耗。


Solargis Prospect 允许用户使用自己喜欢的地理和物理单位,如太阳辐射、温度、经纬度和地形。对于财务部分显示的数字,用户还可以选择最常用的货币单位。

Prospect 计算了整个发电厂生命周期内的预期项目收益。

Prospect 的财务计算器允许输入安装和正常运行的主要光伏系统成本。

在计算项目融资时,除了您输入的电价信息外,Prospect 还会考虑税率和负债率。

在勘探阶段,您自然希望对多个项目选项进行比较。Prospect 的比较功能可同时即时显示多个项目的产量和气候条件,无需提取或导入任何数据。

Prospect 不仅有助于节省数据收集和能源计算任务的时间。它还通过命名、添加标签和归档项目等附加功能,帮助用户将所有项目整理得井井有条。

为方便跨团队成员工作,用户可将项目所有权更改为同一公司订阅中的其他用户。
您可以 在这里下载我们的宣传材料 。