Esta página aún no está traducida al español. Puede verla sólo en inglés.

Pablo Caballero
Sep 24, 2025
One of the most critical outputs from PV simulations is the P50 annual energy yield estimate. Often referred to as the "best estimate," the P50 value represents the annual energy yield that has a 50% probability of being exceeded (with an equal 50% chance that the actual yield will fall below it).
However, relying solely on the P50 value may be too optimistic for project stakeholders. To address this, additional probability-based yield estimates are commonly used e.g. P90 value, which indicates the energy yield expected to be exceeded 90% of the time. This helps provide a broader picture of expected project returns.
In this article, we will explain how to calculate these probabilistic energy yield scenarios and how different ways of calculation impact the final result.
Since representative datasets spanning very long time periods are often unavailable, it is common practice to assume that annual PV yield follows a normal (or Gaussian) distribution for simplification.
In a normal distribution, the center of the curve is represented by the mean, while the width of the curve is defined by the standard deviation (σ or stdev), which quantifies the uncertainty or variability in energy yield estimates.
Let’s now situate the most common probability scenarios within the same normal curve:
These values can be generalized as Pxx estimates, where “xx” indicates the probability of exceedance as a percentage. By positioning these estimates within a normal distribution curve, one can visualize the range of likely outcomes and better understand the risk associated with each.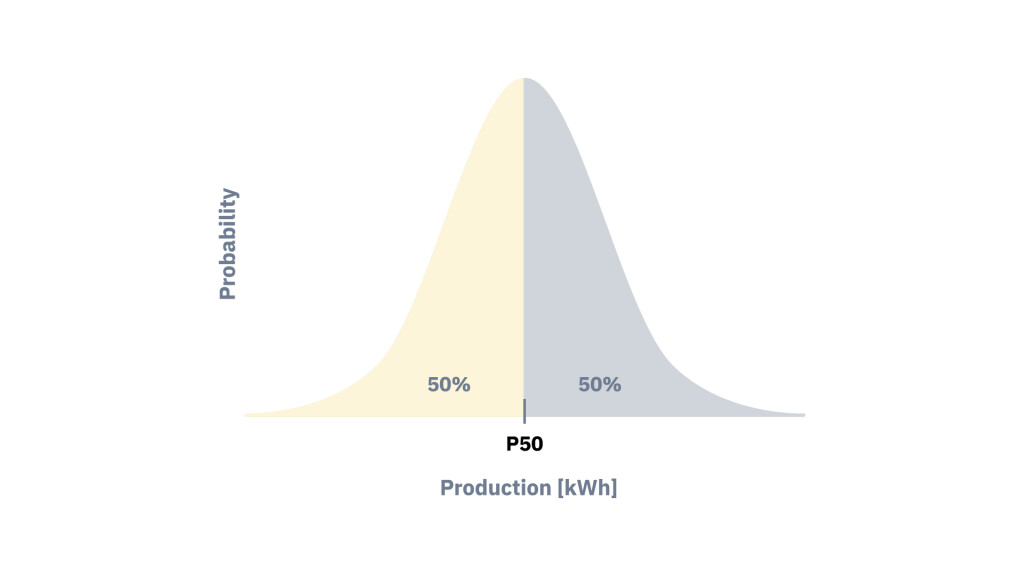
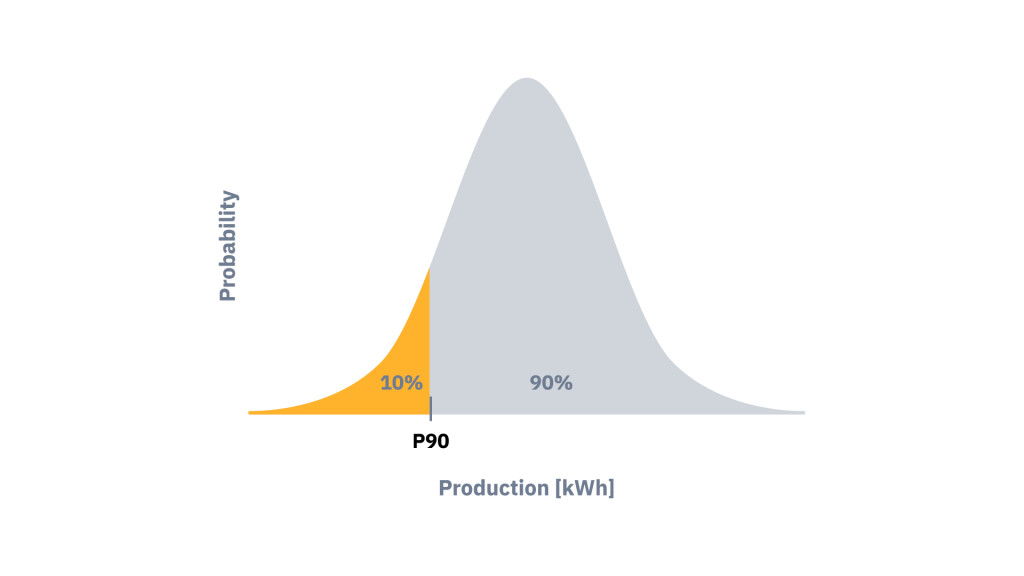
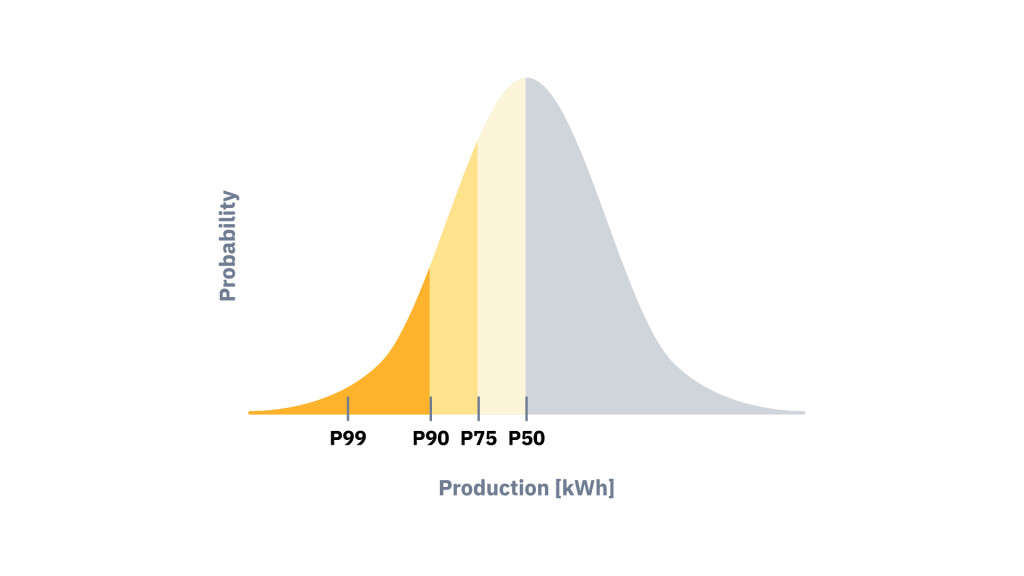
Fig. 1: P50, P75, P90, and P99 values represented in a normal distribution.
Although they may appear related, Pxx scenarios in PV yield estimates should not be confused with statistical percentiles. In statistics, the p90 or 90th percentile is the value below which 90% of a dataset falls. In contrast, a P90 estimate in PV yield assessments represents a yield level that is expected to be exceeded with 90% probability.
One of the key advantages of assuming a normal distribution is the ability to easily derive one Pxx scenario from another using straightforward mathematical relationships.
In all normal distributions, one standard deviation from the mean captures approximately 68.3% of the distribution. This statistical property allows us to calculate exceedance probabilities, such as P90, using simple multipliers.
For example, the P90 yield can be estimated by subtracting 1.282 times the standard deviation from the P50 value. This multiplier corresponds to a 90% probability of exceedance. 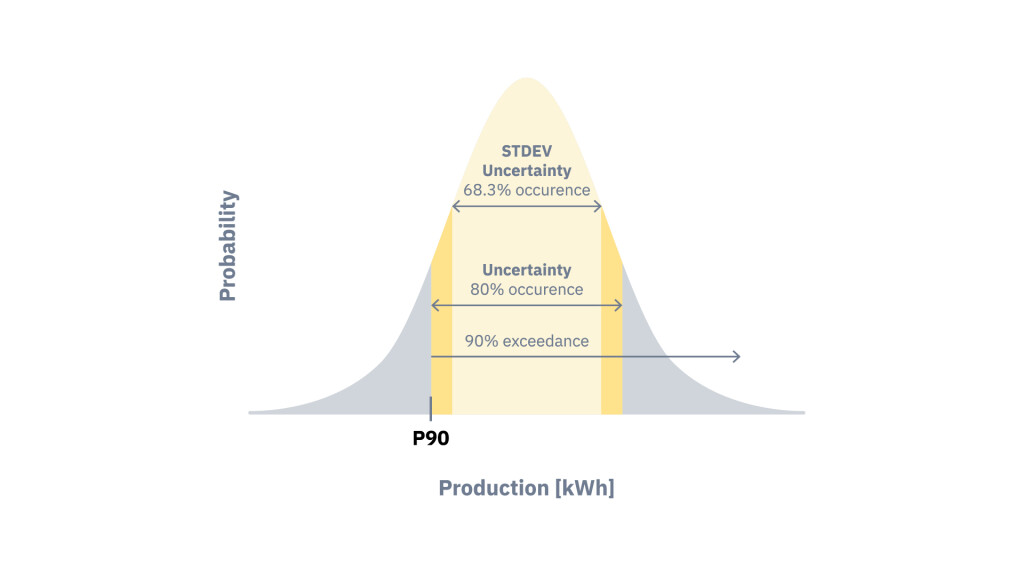
Fig. 2: Uncertainty intervals, expressed at standard deviation and 80% confidence levels (P90 exceedance)
Tab. 1: Calculation of different Pxx from a normal distribution of probability.
|
Probability of occurrence |
Formula |
|
|
One standard deviation |
68.3% |
± STDEV |
|
Two standard deviations |
95.5% |
± 2*STDEV |
|
Three standard deviations |
99.7% |
± 3*STDEV |
|
P75 uncertainty |
50% |
± 0.675*STDEV |
|
P90 uncertainty |
80% |
± 1.282*STDEV |
|
P95 uncertainty |
90% |
± 1.645*STDEV |
|
P97.5 uncertainty |
95% |
± 1.960*STDEV |
|
P99 uncertainty |
98% |
± 2.326*STDEV |
In general, any Pxx value—such as P75 or P99—can be calculated from the P50 estimate using the appropriate multiplier from the Gaussian (normal) distribution.
Tab. 2: Calculation of different Pxx exceedance values for a normal distribution of probability.
|
Probability of exceedance |
Probability of non-excedance |
Formula |
|
|
P50 value |
50% |
50% |
Mean |
|
P75 value |
75% |
25% |
Mean - 0.675*STDEV |
|
P90 value |
90% |
10% |
Mean - 1.282*STDEV |
|
P95 value |
95% |
5% |
Mean - 1.645*STDEV |
|
P97.5 value |
97.5% |
2.5% |
Mean - 1.960*STDEV |
|
P99 value |
99% |
1% |
Mean - 2.326*STDEV |
The total uncertainty associated with a yield estimate should account for all relevant contributing factors, each expressed at the same probability of exceedance. This requires aggregating various sources of uncertainty into a single combined value and understanding how these sources interact and influence one another.
In addition to assuming that PV yield follows a normal (Gaussian) distribution, it is typically assumed that the individual sources of uncertainty are independent. This enables the use of the root-sum-square (RSS) method to calculate the total uncertainty, as follows:
$$U_{\text{total}}= \sqrt{U_1^2 + U_2^2 + \ldots + U_n^2}$$
In the case of PV yield assessments, there are three main factors or components we take into account when calculating the total uncertainty of the annual PV yield:
All these contributing factors are combined in a total uncertainty Utotal in a quadratic sum following the previously mentioned root-sum-square (RSS) method:
$$U_{\text{total}} = \sqrt{U_{\text{model}}^2 + U_{\text{simulation}}^2 + U_{\text{interannual}}^2}$$
In solar energy simulations, it is common to use different types of datasets to estimate expected yield. The choice can be limited to the software that is being used for the output simulation.
Below is an overview of the most commonly used dataset types, along with descriptions and sample data formats.
The historical time series dataset includes all available data from the earliest year (1994, 1999, or 2007, depending on the location) up to the present.
Advantages:
Limitations:
Best Use: Ideal for high-fidelity energy yield simulations and long-term variability assessments. Provides the most realistic input for Pxx scenario modeling.
Download Sample 15-minute Time Series Data (ZIP, 27.3 MB)
The TMY P50 dataset represents the typical climate conditions for each month, selected from the historical dataset. These "typical" months are joined together to form a synthetic year. The dataset is designed to represent a “standard” or most probable year.
Advantages:
Limitations:
Best Use: Widely used for baseline (P50) simulations in early-stage project development.
Download Sample 60-minute TMY P50 Data (ZIP, 0.3 MB)
The TMY P90 dataset represents a conservative year with below-average solar resource conditions. It is built by recombination of monthly data from different years to ensure that the annual GHI is close to the P90 value. This dataset is suitable for simulating conservative yield scenarios.
Advantages:
Limitations:
Best Use: Simulations in early-stage project development that require conservative projections.
Note: In the sample calculation included in this article, we use hourly Typical Meteorological Year (TMY) datasets derived from original time series data. This involves generating a single year of hourly data (8,760 values) from more than 1 million data points.
This should not be confused with simplified methods that also generate a year of hourly data, but using synthetic generators based on monthly long-term averages (LTA), represented by only 12 values.
Synthetic TMY approaches are less accurate, as they introduce artificial variability that does not reflect real conditions, potentially leading to errors of up to 10%. Additionally, they often lack internal consistency between key variables such as GHI and temperature, which can result in unrealistic scenarios (e.g., low GHI paired with high temperatures), ultimately causing underestimation of PV output.
You can learn more about this in this other article.
The variability of energy yield (the third component in the overall uncertainty calculation) is computed using the following formula:
$$\text{var}_n = \frac{\text{stdev}}{\sqrt{n}}$$
Where:
Since PV yield estimates are typically expressed as annual values, in this article we are always using n = 1, which reflects the variability expected in any single year. This is the standard assumption for P90 energy yield calculations.
For longer-term projections, such as over 10, 20, or 25 years, the value of n increases accordingly (e.g., n = 10, 20, 25). In these cases, the overall uncertainty decreases, because the effects of interannual variability become less significant when averaged over longer periods.
The interannual variability value used for the P90 estimate is typically derived from the annual energy yield (PVOUT) based on historical time series data. However, when TMY datasets are used in simulations, interannual variability is often simplified and instead based on historical annual global horizontal irradiance (GHI).
While PVOUT and GHI generally follow similar trends, related interannual variability calculations do not produce identical results. This is because GHI does not capture various dynamic factors involved in converting irradiance into electricity, such as system performance, temperature effects, and other losses.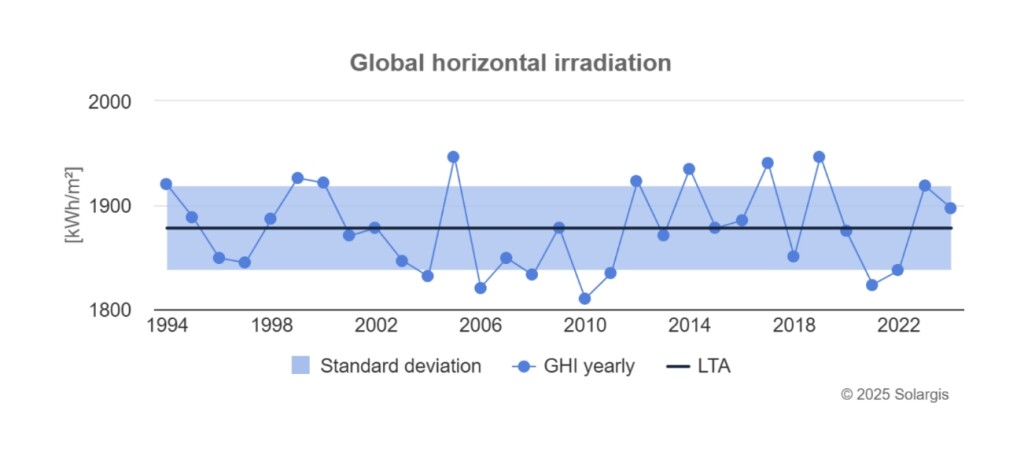
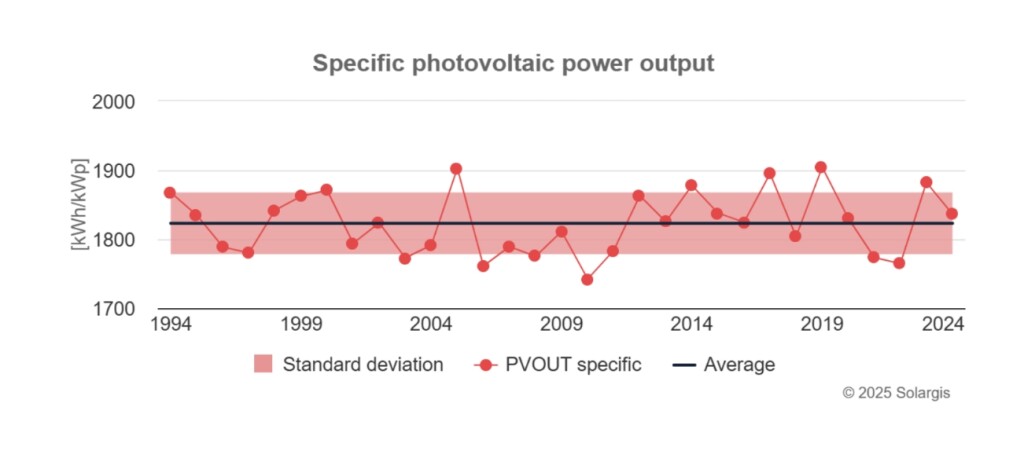
Fig. 3. Representation of annual time series sums for GHI and PVOUT. Source: Evaluate 2.0
1. PVOUT P90 from Full Historical Time Series
2. PVOUT P90 from TMY P50 Dataset
3. PVOUT P90 from TMY P90 Dataset
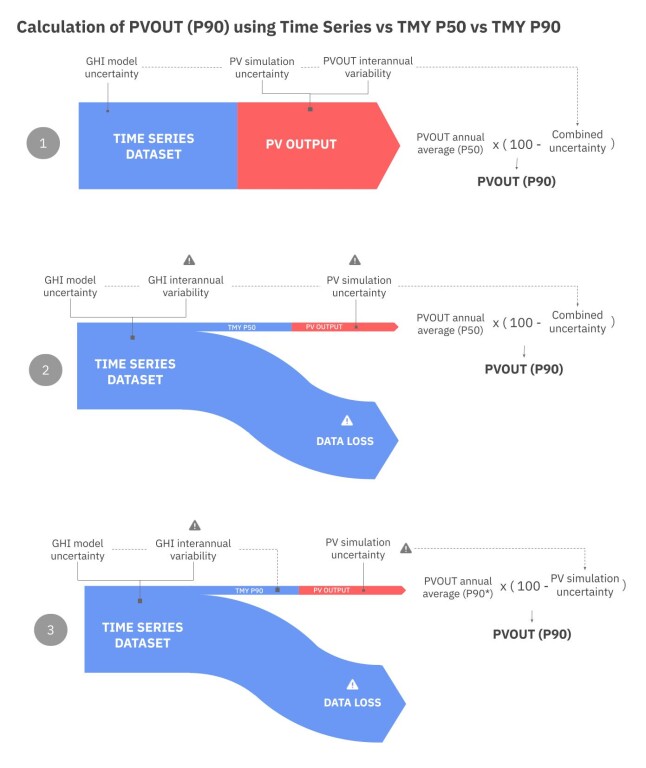
Fig. 4. Diagram showing calculation process of PVOUT P90 from Time Series, TMY P50 and TMY P90 datasets
The findings are summarized in the table below:
Tab. 3. Summary of results from a sample calculation for a project located in Almería, Spain. Please note that these outcomes are specific to the site's characteristics and system layout, and trends may vary for projects in different locations or with different configurations. All uncertainties in the table are expressed at P90 confidence level.
|
Simulation with TS |
Simulation with TMY P50 |
Simulation with TMY P90 |
||
|
P50 annual value |
1705 kWh/kWp |
1716 kWh/ kWp |
1606 kWh/ kWp |
|
|
Uncertainty factors |
Solar radiation model |
±3.5% |
±3.5% |
included in TMY P90 |
|
Energy simulation model |
±5% |
±5% |
±5% |
|
|
Interannual variability |
±3.2% |
±2.6% |
included in TMY P90 |
|
|
Total uncertainty |
±6.9% |
±6.6% |
±5% |
|
|
P90 anual value |
1588 kWh/kWp |
1602 kWh/ kWp |
1526 kWh/ kWp |
|
Accurately estimating expected irradiance under conservative scenarios (e.g., P75, P90, P99, etc) is essential for the successful development and financing of photovoltaic (PV) projects.
Reliable Pxx energy yield assessments must account for several key sources of uncertainty, including the quality of the solar irradiance data, the accuracy of PV simulation models, and the interannual climate variability specific to the project site.
Although it can be expressed using different confidence intervals, uncertainty is a fixed value specific to a given PV project determined by considering various contributing factors. Any change in the level of uncertainty reflects a change in one or more of these underlying factors.
The choice of dataset also has a critical impact on results. Even when based on the same underlying time series, using typical meteorological year (TMY) datasets can introduce notable deviations in P90 yield estimates. These differences arise from the information loss inherent in generating TMY datasets and also from the way uncertainty is treated in the calculation.
Solargis Evaluate gives you the data, simulation tools, and uncertainty quantification to produce audit-ready yield assessments. Explore Evaluate ->
If you prefer expert-led assessment, our team delivers independent PV energy yield assessments with full uncertainty quantification. Learn about the service ->