Pablo Caballero
Apr 8, 2026
Every solar PV project usually starts with one simple number: expected annual PV yield. At first glance, this number looks clear and precise. In reality, however, it always comes with uncertainty.
How a project team deals with this uncertainty matters a lot. It influences engineering design, investor expectations, and bank financing, often in ways that only become visible late in the project lifecycle.
In this article, we explain why actively reducing uncertainty is more effective than simply reporting it. We also share practical ways to achieve this through smarter PV yield simulations.
Using a simple project example, we show how different approaches to uncertainty can lead to very different returns and create distinct risks for project engineers, investors, and banks. The examples are illustrative and are not intended to replicate real project decision-making in detail, but to demonstrate how uncertainty reduction can unlock optimization opportunities for all key stakeholders.
Engineers rely on yield estimates to make design decisions. When those estimates are robust and uncertainty is well understood, engineers can design with confidence, tailoring the system precisely to site conditions. When uncertainty is poorly understood or ignored, engineers lose that precision.
Design choices become conservative by default. Safety margins grow. Optimization gives way to approximation. Sometimes this means adding more equipment than necessary, or relying on conservative sizing choices in electrical design, layout, and loss assumptions. Other times it means leaving performance on the table. Either way, uncertainty limits engineers’ ability to extract full value from the site.
Design optimizations enabled by lower uncertainty include:
Investors rarely assess a project based solely on its expected return. Instead, they focus on the range of possible outcomes and the resilience of returns under less favorable conditions. When yield uncertainty is clearly quantified and transparently communicated, investors can evaluate risk more effectively and form realistic expectations about long-term performance.
When uncertainty is ignored or understated, projects may appear attractive initially, but confidence often weakens during due diligence as underlying assumptions are challenged. In such cases, perceived downside risk increases and the investment case becomes harder to defend.
For this reason, investors place significant value on reliable, long-term production data. Robust data quality is required to make defensible base case, supports downside analysis, and facilitates alignment with lender requirements, which are typically assessed using more conservative assumptions.
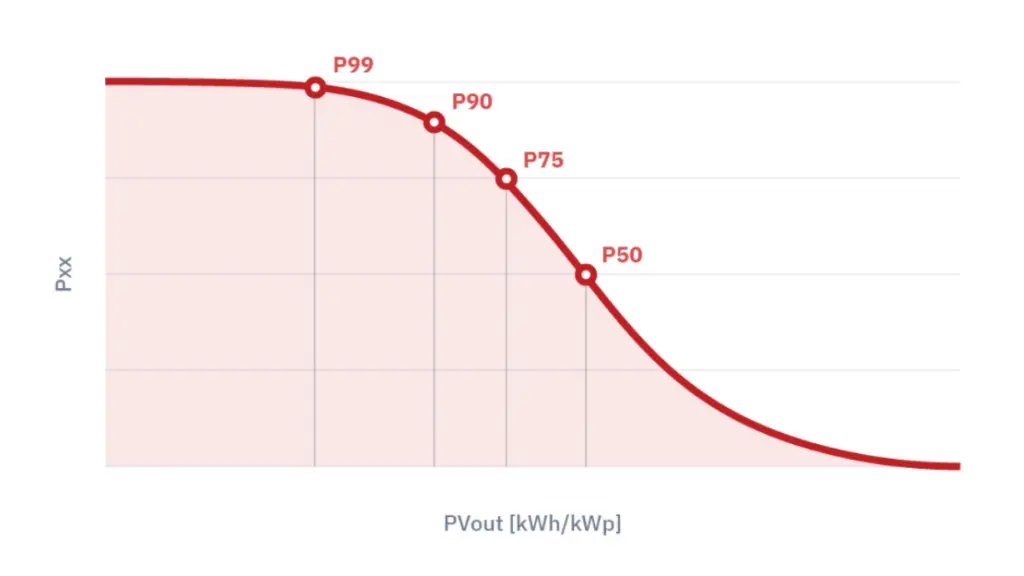
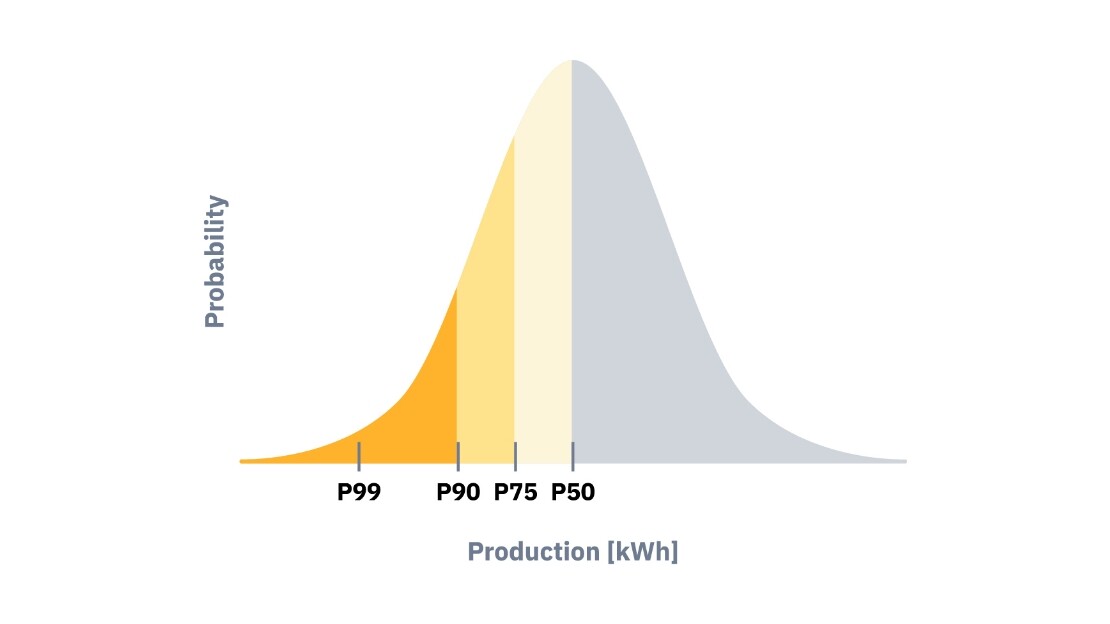
Fig. 1. The probability distribution of PV energy yield illustrates how expected yield decreases as the PXX level increases.
Banks incorporate uncertainty into lending decisions by assessing a project’s ability to meet its debt obligations under conservative assumptions. When uncertainty is clearly quantified and well understood, financing structures can be designed more efficiently.
In standard project finance practice, base-case cash flows are usually based on P50 energy estimates. As yield uncertainty increases, the difference between P50 and more conservative production scenarios, such as P90, becomes larger.
Lenders address this risk mainly through structural and covenant-based mechanisms. Covenants are contractual requirements that obligate the project to meet defined financial or operating thresholds. Typical measures include:
These measures are designed to protect lenders while keeping the base-case financial model intact. As a result, yield uncertainty directly affects how much debt a project can raise and the terms under which it is financed.
When uncertainty is ignored, stakeholders are forced to protect themselves with conservative assumptions. Engineers fall back on generic safety margins, investors struggle to understand downside exposure, and banks respond by limiting loans or tightening terms.
Tab. 1. Differences between ignoring and reporting uncertainty for key project stakeholders.
|
Ignoring uncertainty |
Calculating & reporting uncertainty |
|
|
Engineers |
Rely on generic assumptions and conservative safety margins |
Align design decisions more closely with site-specific conditions |
|
Investors |
Downside returns are unclear and difficult to evaluate |
Return range becomes visible and risks are better understood |
|
Banks |
Apply conservative assumptions that limit debt sizing |
Structure loans with greater confidence and predictability |
Calculating and reporting uncertainty improves transparency, but it does not fully eliminate these frictions, risk is better understood, yet still priced defensively.
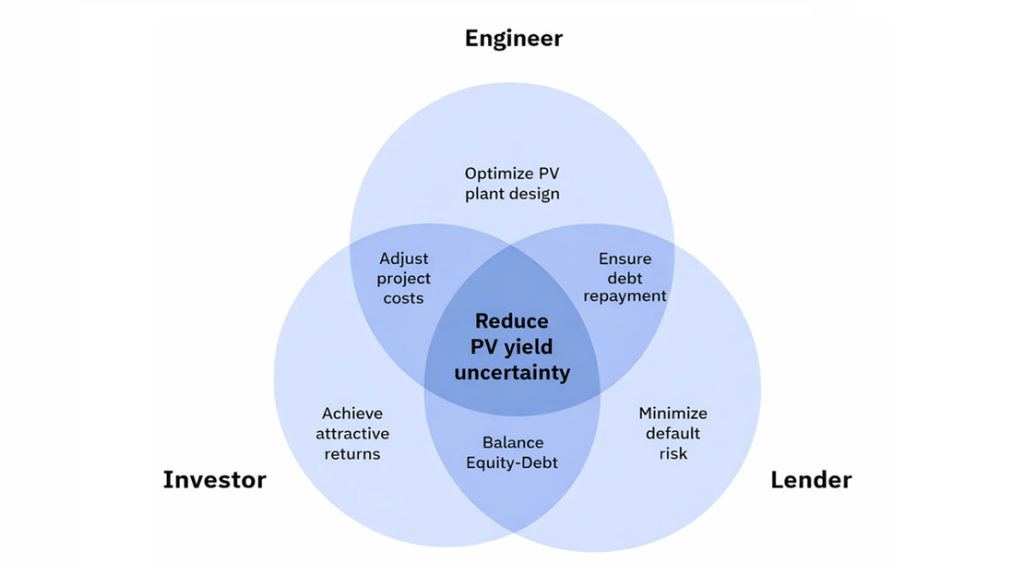
Fig. 2. Reducing PV yield uncertainty is beneficial for each stakeholder’s objective
To reduce uncertainty, it is important to understand the different factors that influence it. In PV yield simulations, uncertainty comes both from the models used by the software and from the external inputs provided by the user.
Many uncertainty-reduction measures can be implemented at low or even zero additional cost, depending on the tools already used in the project. In most cases, the key is choosing the right software and understanding how input data and models are handled internally. Uncertainty assessments must be always driven by validated data.
Practical actions include:
Some additional actions require extra investment, such as installing ground-based measurement equipment. While this increases upfront cost, it is usually small compared to total power plant CAPEX. In complex locations or regions with limited validation of satellite data, complementing satellite irradiance data with on-site measurements and locally adapted models can significantly reduce uncertainty and improve confidence in the results.
A project can either accept uncertainty as it is, or take steps to actively reduce it. When uncertainty is reduced, yield estimates become more reliable. This allows engineers to optimize designs with greater confidence, helps investors improve minimum expected returns, and gives banks more comfort to structure debt efficiently.
The impact of these two approaches is illustrated below through two project scenarios.
Tab. 2. Differences between accepting and reducing uncertainty for key project stakeholders.
|
Accepting current uncertainty |
Actively reducing uncertainty |
|
|
Engineers |
Design remains conservative and less competitive |
Design is optimized while minimizing overdesign and underdesign risks |
|
Investors |
Investment case is weaker due to a wide gap between expected and conservative returns |
Minimum expected returns improve and downside risk is reduced |
|
Banks |
Higher risk exposure drives caution in financing decisions |
Financing costs decrease and capital structure becomes more efficient |
Let’s illustrate this with a sample project: a company is developing a 10 MW solar PV project. The site looks good, the layout is clean, and the expected production is 1,500 kWh per kWp. On paper, everything works.
The engineer runs the yield simulation using standard inputs and a limited dataset. This includes default assumptions instead of physically modelled losses, averaged datasets such as TMY rather than full time series, and hourly simulations instead of sub-hourly resolution. The result looks reasonable, but uncertainty remains relatively high.
The engineer knows the numbers are not wrong, but also knows they are not very tight. So the team decides to move forward as is.
Tab. 3. Uncertainty assumptions used in Sample Scenario A.
|
Uncertainty component |
Value |
Notes |
|
Solar irradiance data uncertainty |
±7.0% |
Standard satellite-based datasets with limited local validation and shorter time series |
|
Interannual variability |
±5.0% |
Natural year-to-year weather variability at the project site |
|
PV simulation uncertainty |
±5.0% |
Default modelling assumptions, simplified loss models, and hourly simulation resolution |
|
Total PV yield uncertainty |
≈±10% |
Combined using the root-sum-square method |
The bank reviews the project using the P90 energy yield.
From the bank’s point of view, the project is financeable, but only just. There is no room for extra leverage.
The equity investor looks at the downside case.
The project reaches financial close, but it is not optimized.
A company is developing a 10 MW solar PV project. The site looks good, the layout is clean, and the expected production is 1,500 kWh per kWp. On paper, everything works.
Before finalizing the design, the team makes a different decision. They invest in better irradiance data, use longer time series, and apply more detailed modeling. The expected energy stays the same, but uncertainty goes down.
Tab. 4. Uncertainty assumptions used in Sample Scenario B.
|
Uncertainty component |
Value |
Notes |
|
Solar irradiance data uncertainty |
±5.0% |
Higher-quality irradiance datasets, longer historical records, and site-adapted validation |
|
Interannual variability |
±5.0% |
Natural year-to-year weather variability at the same site (unchanged) |
|
PV simulation uncertainty |
±4.0% |
More detailed system modelling, higher temporal resolution, and physics-based loss models |
|
Total PV yield uncertainty |
≈±8% |
Combined using the root-sum-square method |
Nothing physical has changed yet—only the confidence in the numbers. With lower uncertainty, the project no longer needs to rely on conservative design margins to achieve the required P90 energy. While the installed capacity remains at 10 MW, the design can be optimized to reduce unnecessary conservatism, resulting in a lower total project cost.
Expected loss assumptions (such as soiling, temperature, and wiring losses) remain unchanged. However, improved data quality and modelling reduce the uncertainty around these losses. This allows a more efficient balance-of-plant design and lower cost without changing expected performance or relying on additional safety margins.
So the design is adjusted:
This is not cutting safety and durability. The project is simply no longer oversized to compensate for uncertainty.
The bank reviews the updated project.
With lower risk, the bank is comfortable increasing leverage:
From the lender’s perspective, risk has not increased, it has actually become better understood.
Now the investor looks at the downside case.
An increase in minimum expected RoE was achieved, with less equity required for the investor.
At first glance, both projects appear very similar. They deliver the same bankable energy and meet the same DSCR requirement. The site, technology, and market conditions have not changed. The only difference is how uncertainty is treated.
Uncertainty reduction is achieved by switching from the existing data and software setup to a more advanced solution. The additional cost of this change is assumed to be negligible compared with the potential capital savings, while increasing expected production at the P90 confidence level.
The comparison in the table below shows that actively reducing uncertainty changes how the same project performs.
Further reductions in uncertainty could be achieved, if needed, through site-specific measurement campaigns and specialized consultancy services, offering additional opportunities to improve project efficiency and financial performance.
Tab. 5. Comparison of two uncertainty scenarios for a sample project.
|
SCENARIO A |
SCENARIO B |
|
|
Specific production |
1,500 kWh/kWp |
1,500 kWh/kWp |
|
PV cost per kWp |
$0.70 |
$0.70 |
|
Energy Price per kWh |
$0.038 |
$0.038 |
|
P50 Annual Energy Production |
15,000 MWh |
15,000 MWh |
|
Uncertainty (P90) |
±10% |
±8% |
|
P90 Annual Production |
13,500 MWh |
13,800 MWh |
|
Project Size |
10.00 MWp |
10.00 MWp |
|
Total Project Cost |
$7,000,000 |
$6,950,000 |
|
Loan Term |
20 years |
20 years |
|
Interest rate |
5.50% |
5.50% |
|
Debt (%) |
70% |
72% |
|
Equity (%) |
30% |
28% |
|
Debt ($) |
$4,900,000 |
$5,004,000 |
|
Equity ($) |
$2,100,000 |
$1,946,000 |
|
DSCR (P90) |
1.25 |
1.25 |
|
RoE (P50) |
7.6% |
7.8% |
|
RoE (P90) |
4.9% |
5.4% |
How a PV project treats yield uncertainty has consequences far beyond the accuracy of a long-term energy forecast. The same expected production can lead to very different designs, financing structures, and investment outcomes depending on the level of uncertainty associated with that estimate.
Modern software solutions allow uncertainty to be actively reduced through higher-quality inputs and more accurate models. This shift enables stronger technical optimization, more resilient financial structures, and greater confidence across stakeholders.
The impact of uncertainty reduction is no longer theoretical:
Uncertainty reduction is a competitive lever, not a risk eliminator: it strengthens confidence and downside resilience, while broader market, grid, and regulatory risks remain decisive. Its impact therefore varies by region, as each market has its own critical factors, constraints, and financing conditions that shape how uncertainty influences project outcomes.
Reducing PV yield uncertainty does not change how much the sun shines. It does not eliminate project risk, but when applied effectively, it offers an opportunity to create a durable competitive advantage for the project.