Productos
menu item
Prospect
Estimación rápida del potencial solar del emplazamiento fotovoltaico
menu item
Evaluate
Datos, diseño y simulación fotovoltaica en una sola solución
menu item
Monitor
Evaluación de la producción fotovoltaica en tiempo real
menu item
Forecast
Previsión de la producción de energía solar para hasta 14 días
menu item
Analyst
Gestión de datos solares simplificada y unificada
menu item
Integraciones
Automatice la entrega de datos Solargis
Casos de uso
menu item
Selección de emplazamientos
Encuentre la ubicación adecuada para su proyecto solar
menu item
Simulación de la producción de energía
Analice los beneficios y riesgos potenciales
menu item
Optimización del diseño de plantas de generación eléctrica
Encuentre el diseño óptimo de la central eléctrica
menu item
Rendimiento real de plantas de generación eléctrica
Conozca la verdadera producción eléctrica
menu item
Predicción de generación
Obtenga predicciones de la producción de energía del proyecto solar
menu item
Verificación de datos de tierra
Verifique la calidad de las mediciones solares y meteorológicas
Evaluación de recursos solares y meteorología
Validación y evaluación detallada del recurso solar
Adaptación al sitio de modelos Solargis
Combinación de datos de satélite con mediciones de tierra
Control de calidad de mediciones solares y meteorológicas
Corrección de errores en los datos medidos en tierra
Datos GIS personalizados
Datos GIS de Solargis personalizados para sus aplicaciones
Evaluación de la producción de energía fotovoltaica
Estimación de incertidumbres de energía y datos de entrada relacionados
Evaluación del rendimiento fotovoltaico
Estimación de energía para refinanciación o adquisición de activos
Estudio de variabilidad fotovoltaica y optimización de almacenamiento
Comprensión de la variabilidad de la producción en amplias regiones geográficas
Estudio del potencial regional de energía solar
Identificación de ubicaciones para plantas de energía solar
menu item
Prospect
Estimación rápida del potencial solar del emplazamiento fotovoltaico
menu item
Evaluate
Datos, diseño y simulación fotovoltaica en una sola solución
menu item
Monitor
Evaluación de la producción fotovoltaica en tiempo real
menu item
Forecast
Previsión de la producción de energía solar para hasta 14 días
Nuestra experiencia y conocimientos
Cómo funciona nuestra tecnología
Metodología
Cómo transformamos la ciencia en tecnología
Guías de productos y documentación
Notas de la versión
Casos de éxito
Blog
Ebooks
Seminarios web
Publicaciones
Eventos
Mapas y datos GIS gratuitos
Acerca de Solargis
Socios
Certificación ISO
Empleo

Esta página aún no está traducida al español. Puede verla sólo en inglés.

New generation Solargis Evaluate: data, PV design & simulation, analysis, and reports in one cloud-based solution. Discover more ->

At Solargis, we’ve just released Solarmaps: a new solution designed to empower PV power plant portfolio managers, operators, and analysts.

Solargis Solarmaps provides timely and accurate insights into the monthly availability of solar resource, air temperature, precipitation (rainfall), and wind speed — key factors that influence PV power plant performance.

In this article, we share what Solarmaps is and how it can support your PV portfolio management.

Diagnosing PV performance in context

Are you considering environmental effects in your PV plant performance evaluation? When performing an initial diagnosis of PV asset performance, the Solargis Solarmaps interactive map offers a complete geographical context of solar and meteorological events. This helps you understand whether your PV system performed in line with actual weather conditions, enhancing transparency and accountability in PV asset management.

Solarmaps allows you to pinpoint specific weather-related events and link them to your PV plant’s performance in the previous month. You can either explore a world map overview or select a precise location (up to three sites) to access localized data.
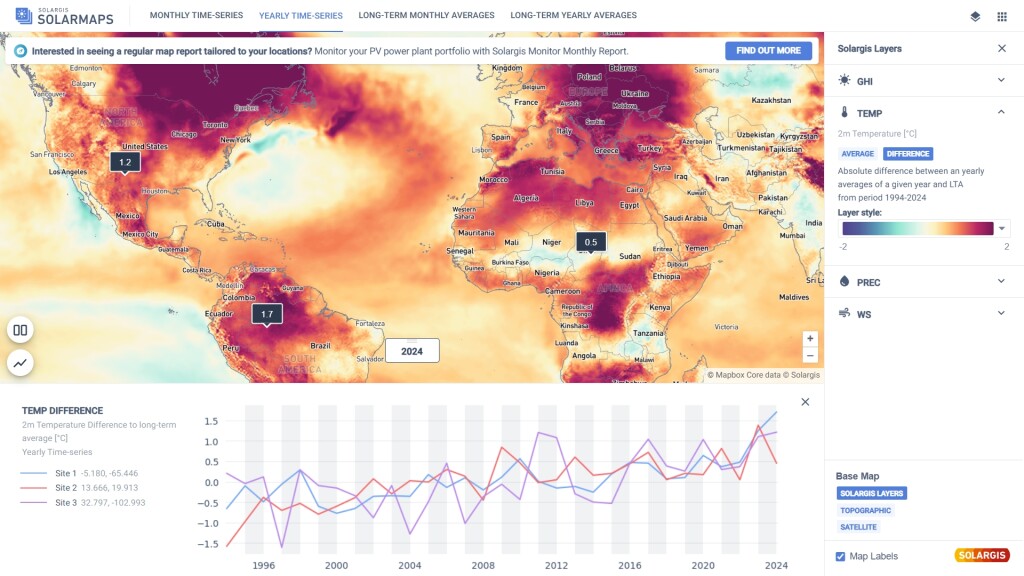
yearly time series solarmaps

What data can you access in Solargis Solarmaps?

In the upper banner of the Solarmaps interface, you’ll find tabs displaying different data aggregations. Depending on the selected tab, the map layer updates to show the corresponding values.

For the latest month and the latest calendar year:

  • Monthly & yearly summary of Global Horizontal Irradiation (GHI)
  • Monthly & yearly GHI difference vs. long-term average
  • Monthly & yearly average air temperature (2 metres)
  • Monthly & yearly air temperature difference vs. long-term average
  • Monthly & yearly precipitation summary
  • Monthly & yearly precipitation difference vs. long-term average
  • Monthly & yearly average wind speed
  • Monthly & yearly wind speed difference vs. long-term average

Long-term monthly and annual averages:

  • GHI
  • Air temperature
  • Precipitation
  • Wind speed

When new data for a recent month becomes available, the existing monthly dataset will be replaced with the most recent month. At any given time, only data for the previous month is accessible.

Key features of Solargis Solarmaps

1. Site-specific data

To view precise, site-specific data for the previous month, simply click on the map to locate your projects. You can select up to three sites at once. Values for the previous month can be compared with long-term averages, helping you attribute deviations in performance to environmental conditions.

The same applies to yearly data. Simply switch the tab in the upper menu from monthly to yearly time-series to access last year’s values.
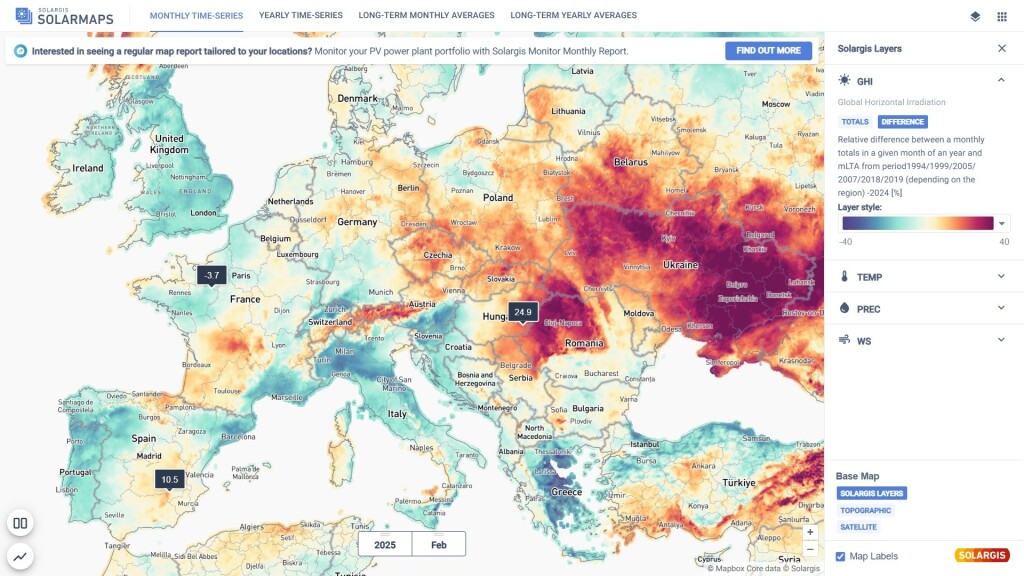
monthly time series solarmaps

2. Custom value range

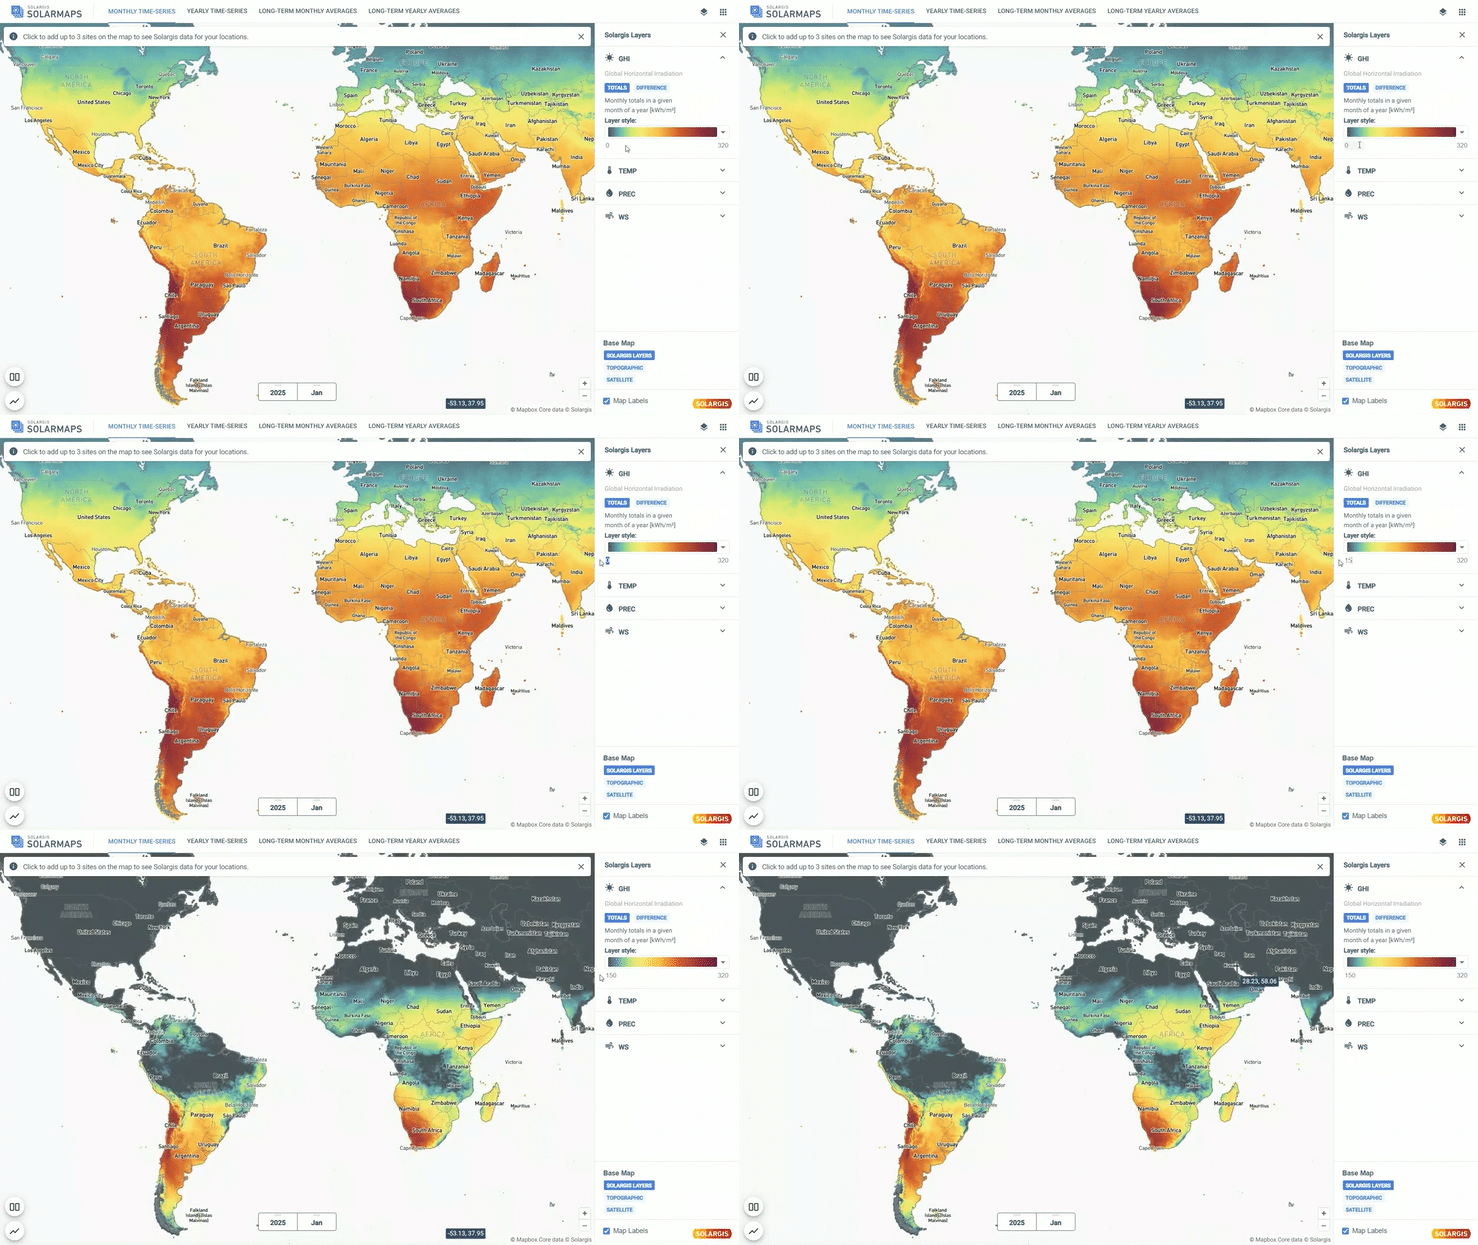
Once a map layer is selected, you can customize the color scale for the selected parameter for better visualization. This helps highlight areas that are in line with your desired range. To adjust the range, edit the values under the Style section on the right-hand side.
3. Split view

With the split view feature, you can divide the map window into two panels and compare selected variables side by side. This allows you to analyze the correlation between monthly air temperature and GHI in one screen and assess its impact on monthly PV performance.
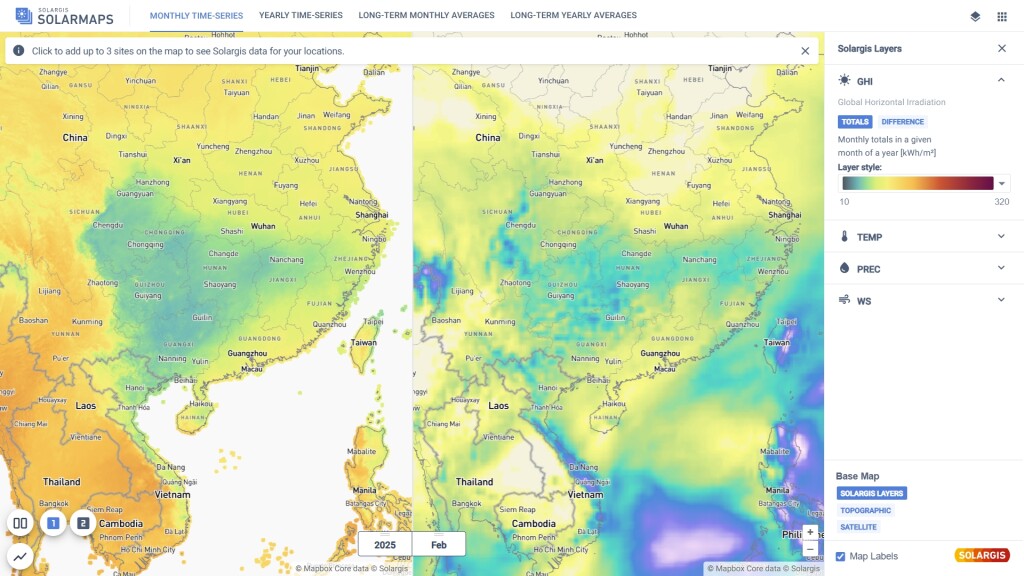
split view solarmaps

4. Graphs

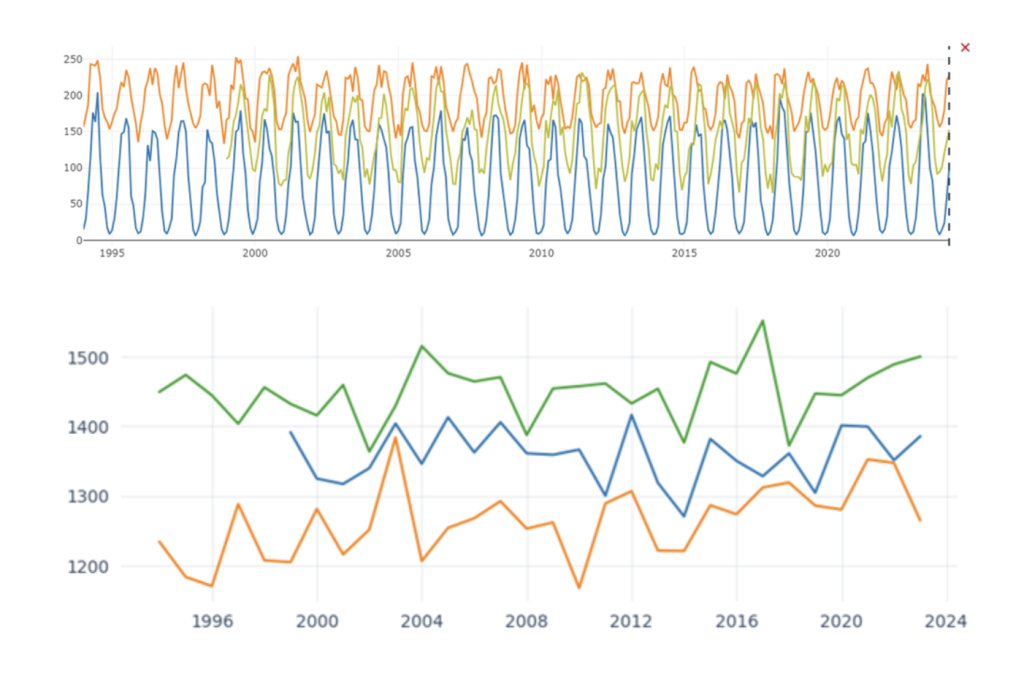
You can select up to three sites and display them in a graph to visualize the full history of monthly or yearly time series data. This makes it easy to spot cyclic changes and seasonal trends. Graphs can be exported in PNG format with a simple right-click for use in reports and presentations.
Solargis solarmaps graphs

How can I access Solargis Solarmaps?

Only Solargis customers can get access to Solargis Solarmaps. The application is automatically available to anyone with an active subscription to any Solargis solution.

Access your account here: https://apps.solargis.com/ 

Keep reading

Precipitable Water (PWAT) - new data parameter
Solargis news

Precipitable Water (PWAT) - new data parameter

Precipitable water or ‘PWAT’ in short, is the depth of water in a column of the atmosphere if all the water in that column were precipitated as rain.

Training in Beijing: sharing our knowledge with chinese professionals and the public
Solargis news

Training in Beijing: sharing our knowledge with chinese professionals and the public

We shared our knowledge with professionals in the solar energy industry in China during Assessment of solar resource measurement technology exchange event.

Annual average values of solar resource and temperature are now available for free via iMaps
Solargis news

Annual average values of solar resource and temperature are now available for free via iMaps

From today onwards, we are also opening access to long-term annual averages of key solar parameters GHI, DIF, and DNI via Solargis iMaps prospecting tool.