
Participa en nuestro próximo seminario web «¿Se puede confiar en los datos medidos?», que tendrá lugar el 27 de octubre de 2026 a las 10:00 h CET. Inscríbete aquí
El granizo suele percibirse como un peligro poco frecuente e impredecible, un fenómeno extremo y repentino que se produce sin previo aviso.
En el caso de las instalaciones fotovoltaicas (FV), cuya vida útil oscila entre los 25 y los 35 años, esta percepción es errónea. En realidad, el granizo que causa daños sigue patrones espaciales y estacionales que se repiten y evolucionan a lo largo de décadas.
Por lo tanto, comprender estos patrones a largo plazo es esencial para tomar decisiones informadas en materia de inversión, diseño y seguros.
Solargis Prospect incluye ahora un mapa mundial de riesgo de granizo, en el que se destacan las regiones con condiciones atmosféricas recurrentes propensas a un granizo dañino. Está diseñado para la evaluación del riesgo a largo plazo, más que para la predicción a nivel de eventos concretos.
En el artículo que figura a continuación, descubrirás:
En primer lugar, es importante distinguir entre la climatología del granizo y la predicción del granizo.
La predicción de granizo ayuda a proteger las plantas fotovoltaicas de cara al futuro.
La climatología del granizo ayuda a proteger las inversiones durante décadas.
Utilizadas conjuntamente, conforman un marco integral de gestión del riesgo de granizo.
Los módulos fotovoltaicos suelen estar certificados para soportar impactos moderados de granizo, lo que corresponde a bolas de hielo de aproximadamente 25 mm (1 pulgada) de diámetro. Los granizos de mayor tamaño pueden provocar fracturas en el vidrio, microfisuras y pérdidas de rendimiento latentes que pueden no hacerse evidentes hasta años más tarde. Los granizos de 50 mm (~2 pulgadas) o más suelen superar los umbrales de certificación y pueden romper el vidrio, destruyendo inmediatamente el módulo fotovoltaico estándar.
A medida que el despliegue fotovoltaico a gran escala se expande a regiones expuestas a tormentas convectivas severas, el riesgo de granizo a largo plazo se convierte en un factor clave que influye en:
Aunque no es posible predecir tormentas de granizo concretas con años de antelación, sí se puede cuantificar la frecuencia de los fenómenos propensos al granizo en una ubicación determinada.
En Solargis, hemos desarrollado un modelo global para estimar la ocurrencia de eventos de granizo dañinos. El modelo se basa en múltiples variables atmosféricas derivadas de datos de reanálisis con una resolución temporal horaria. El análisis abarca un periodo de 10 años (2015-2024) y se parametriza utilizando eventos de granizo localizados observados y confirmados. El resultado es un mapa mundial de riesgo de granizo (Figura 1) que muestra el número medio anual de días con potencial de granizo dañino.
Los usuariosde Solargis Prospect pueden acceder al mapa global de riesgo de granizo, incluidos los datos agregados mensuales (Figura 2), directamente desde la plataforma. El mapa destaca las regiones con condiciones atmosféricas recurrentes propicias para fenómenos de granizo destructivos y está diseñado para la evaluación del riesgo a largo plazo, más que para la predicción a nivel de cada fenómeno concreto.
Esta información respalda las decisiones estratégicas mucho antes de que comience la construcción y complementa las previsiones de granizo a corto plazo que se utilizan durante el funcionamiento de las plantas fotovoltaicas.
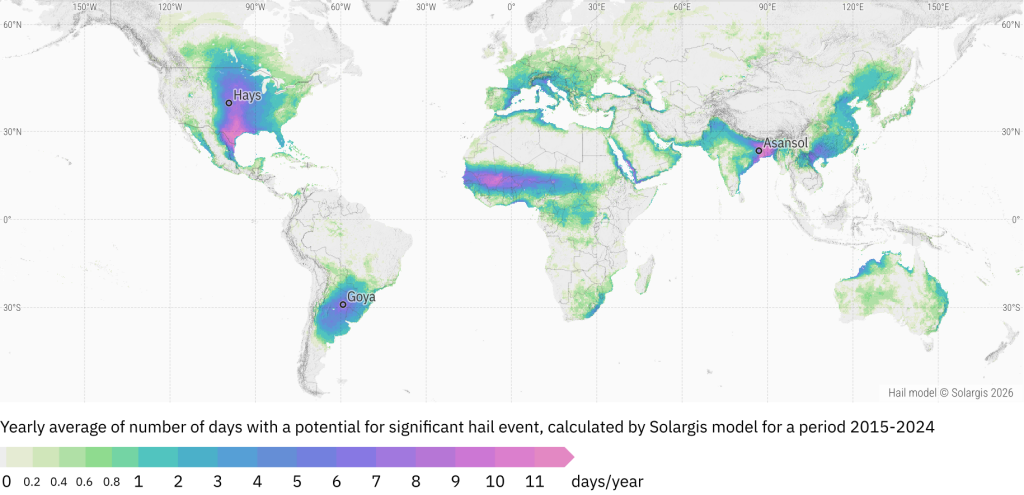
Figura 1: Mapa mundial que indica el riesgo de granizo para las instalaciones fotovoltaicas
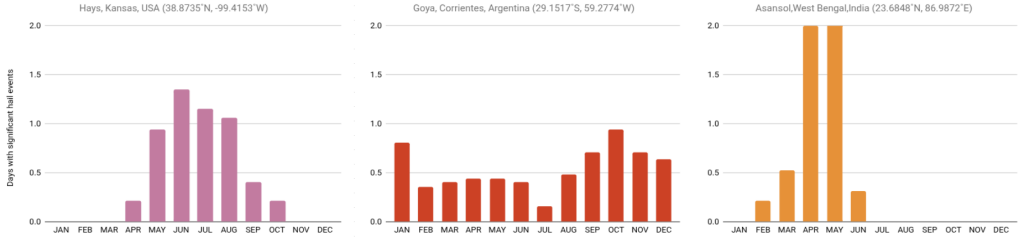
Figura 2: Número medio mensual de días con riesgo de granizo significativo, que muestra la variabilidad estacional en tres emplazamientos seleccionados. Consulte su ubicación en el mapa de la Figura 1.
Los episodios de granizo dañinos son, por naturaleza, localizados. Los recuentos indicados se agrupan por celda de malla de 0,25°, lo que corresponde a un área de aproximadamente 28 × 28 km.
Por ejemplo, un valor de cinco indica, por lo tanto, la posibilidad de que se produzcan varios episodios de granizo significativo y localizados dentro de esta zona a lo largo de un año medio, y no una exposición generalizada o continua.
El mapa (figura 1) muestra una distribución global muy desigual del potencial de granizo significativo en el período 2015-2024. Las grandes extensiones de tierra (en gris) no presentan condiciones atmosféricas propicias para la formación de granizo significativo. Las regiones que aparecen en verde indican condiciones de riesgo ocasionales, lo que corresponde a un máximo de un episodio potencial al año. El azul representa hasta cinco episodios potenciales al año, mientras que el morado indica más de cinco.
La variabilidad estacional del potencial de granizo difiere notablemente entre regiones. La figura 2 presenta tres ubicaciones seleccionadas, cada una con una media de aproximadamente siete días propensos al granizo al año. A pesar de que los totales anuales son similares, sus distribuciones estacionales varían sustancialmente.
Cerca de Goya, en Corrientes (Argentina), las condiciones para que se produzca granizo significativo dan lugar en la mayoría de los meses del año, lo que indica una débil modulación estacional. Por el contrario, las otras dos localidades muestran picos estacionales pronunciados. En Hays, Kansas (EE. UU.), el potencial de granizo se concentra en la temporada de verano, con un máximo entre mayo y agosto. En Asanol, Bengala Occidental (India), el período dominante es el premonzónico, con picos intensos en abril y mayo.
Caracterizar la variabilidad estacional es fundamental para los operadores de instalaciones fotovoltaicas, ya que permite planificar oportunamente las medidas de monitorización, respuesta ante emergencias y mitigación a lo largo de todo el año.
Los informes históricos sobre granizo proporcionan información valiosa sobre sucesos pasados, pero por sí solos no son suficientes para una evaluación del riesgo a largo plazo. La densidad de los informes varía considerablemente en función de la población y las infraestructuras, lo que deja a grandes regiones infrarrepresentadas. Muchos episodios de granizo pasan desapercibidos, y las prácticas de notificación cambian con el tiempo.
En consecuencia, las zonas con pocos informes no tienen por qué presentar un riesgo bajo de granizo; es posible que simplemente carezcan de observadores. Se necesita un enfoque coherente y basado en la física para evaluar el riesgo de granizo en todas las regiones y a lo largo de décadas.
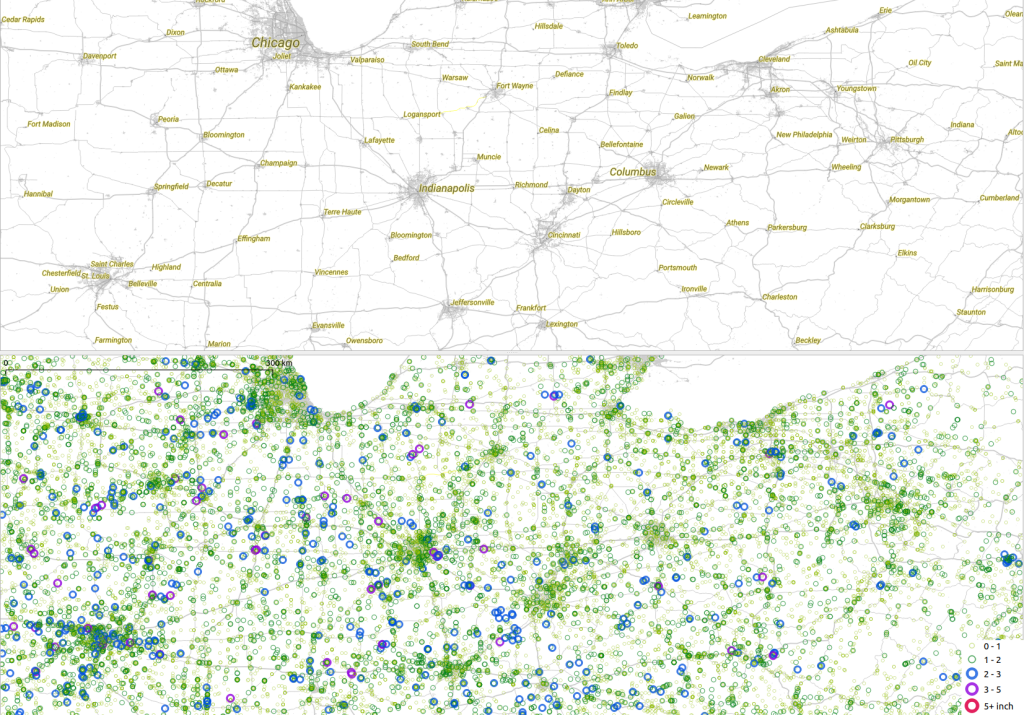
Figura 3: Registros de eventos de granizo observados durante un periodo de 30 años (2004-2023) por el Centro de Predicción de Tormentas (NOAA) en el centro de EE. UU. La densidad de las observaciones notificadas se correlaciona con la distribución de las zonas urbanas y los corredores de transporte.
Para superar las limitaciones de las observaciones brutas, utilizamos datos de reanálisis atmosférico, que reconstruyen las condiciones meteorológicas pasadas de forma físicamente coherente, hora a hora, en todo el mundo.
Esto proporciona una visión completa de los entornos en los que puede formarse el granizo. Estos entornos vienen definidos por una combinación de factores. La inestabilidad atmosférica aporta energía. La cizalladura del viento ayuda a organizar las tormentas. La estructura termodinámica y la humedad determinan si los granizos pueden crecer lo suficiente como para causar daños. Ninguno de estos ingredientes es suficiente por sí solo. El granizo se forma solo cuando todos ellos se combinan de la manera adecuada.
Para captar esta complejidad, se combinan datos atmosféricos a largo plazo con técnicas de aprendizaje automático. Los episodios de granizo observados y notificados desempeñan un papel clave en este paso: anclan el modelo a la realidad. El modelo aprende qué condiciones atmosféricas estaban presentes en el momento y el lugar exactos en los que se notificó granizo dañino. A continuación, esta relación aprendida se generaliza utilizando principios de aprendizaje automático. En lugar de centrarse en eventos extremos individuales, la atención se centra en la frecuencia con la que un lugar determinado experimenta condiciones propicias para el granizo dañino.
El análisis comienza a escala horaria. Se identifican las horas con un potencial elevado de granizo y se agrupan en días con riesgo sostenido. A continuación, estos días se agregan a lo largo de muchos años para elaborar una climatología del granizo. El resultado es un mapa que refleja la exposición a largo plazo al riesgo de granizo, en lugar de tormentas aisladas y de corta duración.
Para obtener una descripción más detallada del modelo de riesgo de granizo de Solargis, consulta este artículo.
El granizo no es la amenaza ambiental más frecuente para las instalaciones fotovoltaicas. Sin embargo, cuando se produce, las consecuencias pueden ser graves. La «Evaluación de riesgos solares para 2025» del mercado estadounidense, realizada por kWh Analytics, muestra que el granizo representa el 73 % de las pérdidas económicas totales, aunque solo supone el 6 % de los incidentes con pérdidas. En otras palabras, el granizo es poco frecuente, pero costoso.
Nuestro mapa mundial refleja una situación similar. Gran parte de Estados Unidos se enfrenta a un riesgo de granizo que va de leve a grave. Aparecen otros puntos críticos en el noreste de Argentina, la parte nororiental del África subsahariana, Bengala Occidental, el norte de Vietnam y la provincia vecina de Guangxi, en China. En Europa, los corredores de riesgo más conocidos discurren a lo largo del río Po, en Italia, y de la costa este de España.
Para comprender lo que esto significa para los operadores fotovoltaicos, hemos combinado la base de datos de plantas solares de «Global Renewables Watch 2024» con nuestra clasificación de riesgo de granizo. El conjunto de datos refleja la ubicación de las plantas fotovoltaicas a escala industrial a mediados de 2024. Hemos agrupado el riesgo de granizo en cuatro categorías, hemos superpuesto los activos fotovoltaicos (Figura 4) y hemos analizado tanto el número de plantas fotovoltaicas como la superficie de terreno ocupada (Figura 5). Los resultados ofrecen una perspectiva clara sobre la exposición al riesgo de la cartera.
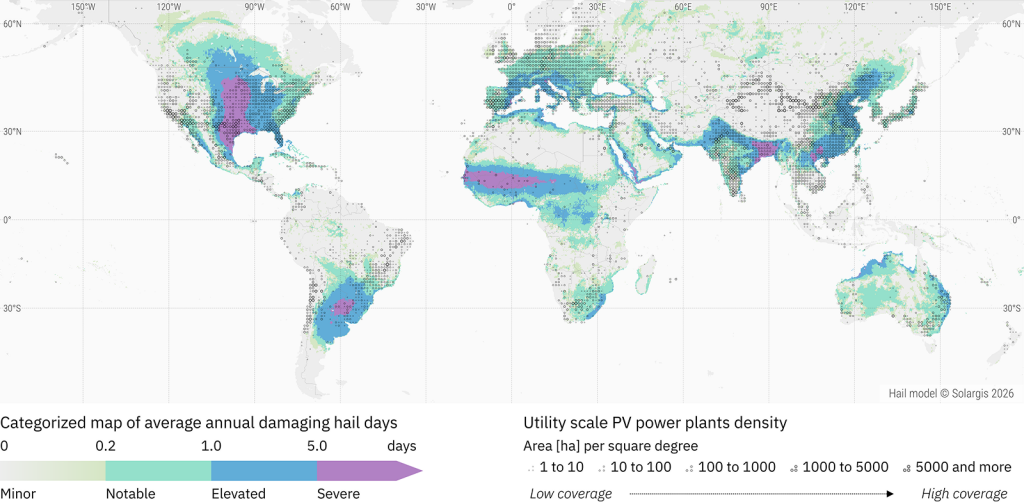
Figura 4: Distribución geográfica de las plantas fotovoltaicas a escala industrial a nivel mundial en el contexto de las zonas clasificadas según el riesgo de granizo
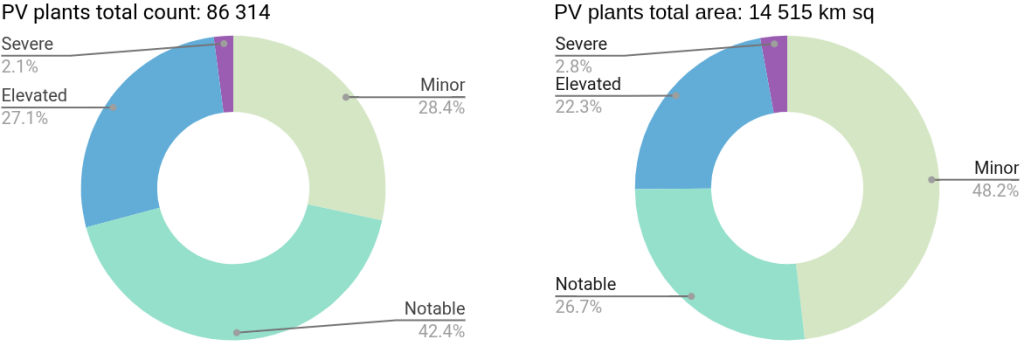
Figura 5: Distribución relativa de las centrales fotovoltaicas a escala industrial en las zonas de riesgo de granizo según (a) el número de centrales fotovoltaicas y (b) la superficie ocupada
Comprender el riesgo de granizo a largo plazo cobra cada vez más importancia, especialmente si sus activos fotovoltaicos se encuentran en zonas con mayor riesgo de granizo.
El mapa climatológico de granizo de Solargis Prospect, basado en datos atmosféricos físicamente coherentes y en el aprendizaje automático, ofrece una visión imparcial de los lugares donde es más probable que se produzca granizo dañino a lo largo de la vida útil de un proyecto fotovoltaico.
A diferencia de las previsiones a corto plazo, el mapa de riesgo de granizo está diseñado para la evaluación del riesgo a largo plazo. Muestra dónde el riesgo de granizo es estructuralmente mayor a lo largo del tiempo, lo que facilita la selección de emplazamientos en fases iniciales, el diseño de proyectos, las consideraciones sobre seguros y la protección de los activos a largo plazo.
Al combinar la climatología del granizo a largo plazo con las previsiones de granizo a corto plazo, los usuarios de Prospect disponen de un potente conjunto de herramientas para reducir el riesgo, optimizar las decisiones de diseño y proteger las inversiones a largo plazo.
Si tiene alguna pregunta o necesita más información, póngase en contacto con nosotros y estaremos encantados de ayudarle.