本页未翻译。您正在浏览的是英文版本。
Hail is often perceived as a rare and unpredictable hazard, a sudden extreme event that strikes without warning.
For photovoltaic (PV) assets with a lifetime of 25–35 years, this perception is misleading. In reality, damaging hail follows spatial and seasonal patterns that repeat and evolve over decades.
Understanding these long‑term patterns is therefore essential for making informed investment, design, and insurance decisions.
Solargis Prospect now features a global hail risk map, highlighting regions with recurrent atmospheric environments prone to damaging hail. It is designed for long-term risk assessment rather than event-level prediction.
In the article below, you'll learn:
First, it is important to distinguish between hail climatology and hail forecasting.
Hail forecasting helps protect PV plants tomorrow.
Hail climatology helps protect investments for decades.
Used together, they form a comprehensive hail‑risk framework.
PV modules are typically certified to withstand moderate hail impacts, corresponding to ice balls of approximately 25 mm (1 inch) in diameter. Larger hailstones can cause glass fracture, micro‑cracks, and latent performance losses that may only become apparent years later. Hailstones with 50 mm (~2 inches) or more often exceed certification thresholds and can break the glass, destroying the standard PV module immediately.
As utility‑scale PV deployment expands into regions exposed to severe convective storms, long‑term hail risk becomes a key factor influencing:
While individual hailstorms cannot be predicted years in advance, the frequency of hail‑prone events at a given location can be quantified.
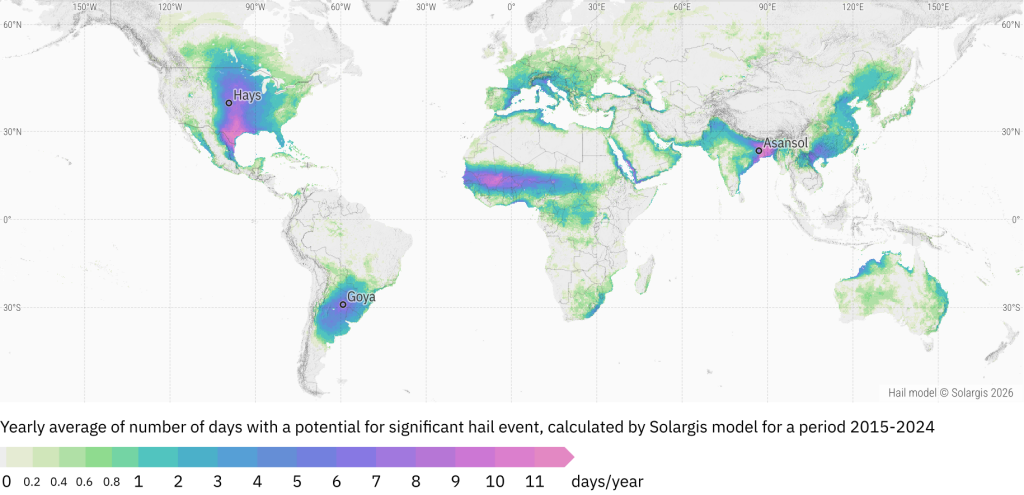
At Solargis, we developed a global model to estimate the occurrence of damaging hail events. The model is driven by multiple atmospheric variables derived from reanalysis data at an hourly temporal resolution. The analysis covers a 10-year period (2015–2024) and is parameterized using observed and confirmed localized hail events. The output is a global hail risk map (Figure 1) showing the yearly average number of days with potential for damaging hail.
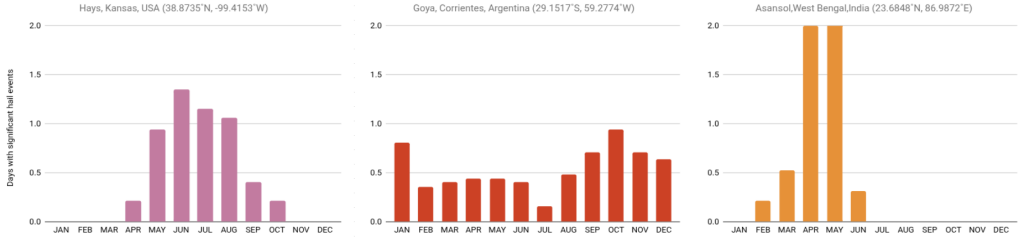
Solargis Prospect users can access the global hail risk map, including monthly aggregates (Figure 2), directly in the platform. The map highlights regions with recurrent atmospheric environments prone to damaging hail events and is designed for long-term risk assessment rather than event-level prediction.
These insights support strategic decisions long before construction begins and complement short‑term hail forecasts used during PV plant operation.
Figure 1: Global map indicating the hail risk for PV assets
Figure 2: Average monthly number of days with potential for significant hail, showing seasonal variability across three selected sites. See their locations on the map in Figure 1.
Damaging hail events are inherently localized. The reported counts are aggregated per 0.25° grid cell, corresponding to an area of approximately 28 × 28 km.
For example, a value of five therefore indicates the potential for several localized significant hail events within this area over one average year, not widespread or continuous exposure.
The map (Figure 1) shows a highly uneven global distribution of significant hail potential in the period 2015–2024. Large land areas (grey) exhibit no atmospheric conditions conducive to the formation of significant hail. Regions shown in green indicate occasional risk conditions, corresponding to up to one potential event per year. Blue represents up to five potential events per year, while purple indicates more than five.
Seasonal variability of hail potential differs markedly across regions. Figure 2 presents three selected locations, each with an average of approximately seven hail-prone days per year. Despite similar annual totals, their seasonal distributions vary substantially.
Near Goya, Corrientes (Argentina), conditions for significant hail occur in most months of the year, indicating a weak seasonal modulation. In contrast, the other two locations show pronounced seasonal peaks. In Hays, Kansas (USA), hail potential is concentrated in the summer season, with a maximum from May to August. In Asanol, West Bengal (India), the dominant period is pre-monsoon, with strong peaks in April and May.
Characterizing seasonal variability is critical for PV operators, as it supports timely planning of monitoring, emergency response, and mitigation measures throughout the year.
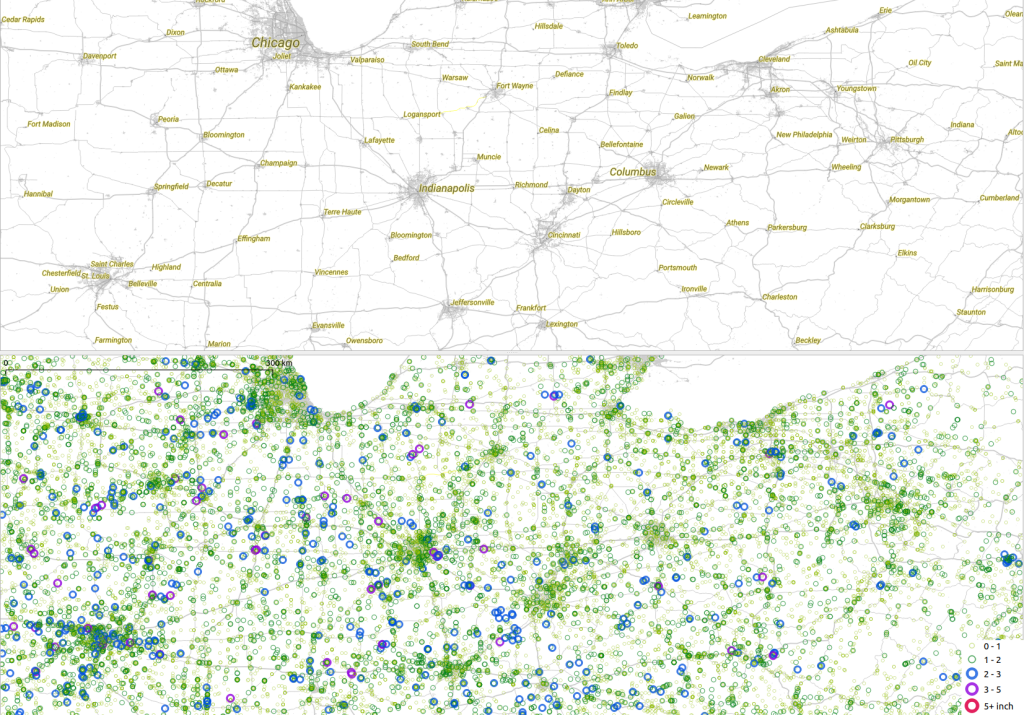
Historical hail reports provide valuable information about past events, but they are not sufficient for long‑term risk assessment on their own. Reporting density varies strongly with population and infrastructure, leaving large regions under‑represented. Many hail events remain unobserved, and reporting practices change over time.
As a result, areas with few reports do not necessarily experience low hail risk — they may simply lack observers. A consistent, physics‑based approach is needed to assess hail risk across regions and decades.
Figure 3: Records on observed hail events for a period of 30 years (2004-2023) by Storm Prediction Center (NOAA) in the central USA. Density of reported observations correlates with patterns of urban areas and transportation corridors.
To overcome the limitations of raw observations, we use atmospheric reanalysis data, which reconstruct past weather conditions in a physically consistent way, hour by hour, across the globe.
This provides a complete picture of the environments in which hail can form. These environments are defined by a combination of factors. Atmospheric instability supplies energy. Wind shear helps organize storms. Thermodynamic structure and moisture determine whether hailstones can grow large enough to become damaging. None of these ingredients is sufficient on its own. Hail forms only when they come together in the right way.
To capture this complexity, long-term atmospheric data are combined with machine-learning techniques. Observed and reported hail events play a key role in this step: They anchor the model in reality. The model learns which atmospheric setups were present in the exact time and location where damaging hail was reported. This learned relationship is then generalized using machine-learning principles. Rather than chasing individual extreme events, the focus shifts to how often a given location experiences environments prone to damaging hail.
The analysis starts at an hourly scale. Hours with elevated hail potential are identified and combined into days with sustained risk. These days are then aggregated over many years to build a hail climatology. The result is a map that reflects long-term exposure to hail risk, rather than isolated, short-lived storms.
For a more detailed description of the Solargis Hail Risk Model, see this article.
Hail is not the most frequent environmental threat to PV assets. But when it strikes, the consequences can be severe. The 2025 Solar Risk Assessment for the U.S. market, led by kWh Analytics, shows that hail accounts for 73% of total financial losses while representing only 6% of loss incidents. In other words, hail is rare but costly.
Our global map tells a similar story. Much of the United States faces mild to severe hail risk. Additional hotspots appear in Northeast Argentina, the northeastern part of Sub-Saharan Africa, West Bengal, North Vietnam, and the neighboring Guangxi province in China. In Europe, the best-known risk corridors run along the Po River in Italy and Spain’s eastern coast.
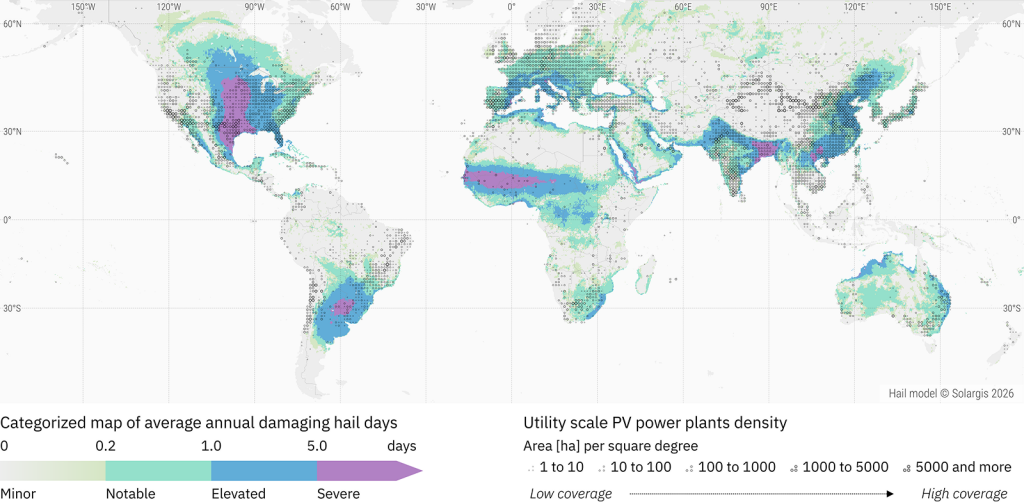
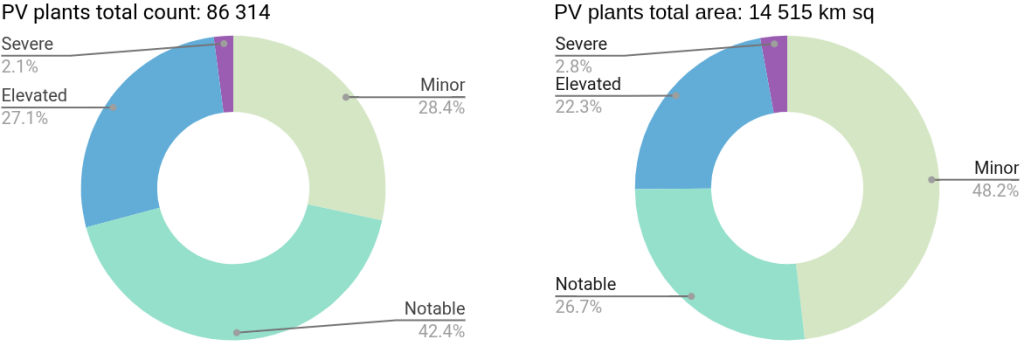
To understand what this means for PV operators, we combined the Global Renewables Watch 2024 database of solar plants with our hail risk classification. The dataset reflects utility-scale PV plant locations as of mid-2024. We grouped hail risk into four categories, overlaid the PV assets (Figure 4), and analyzed both PV plant counts and occupied land area (Figure 5). The results offer a clear perspective on portfolio risk exposure.
Figure 4: Geographic distribution of global utility-scale PV plants in the context of categorized hail-risk zones
Figure 5: Relative distribution of utility-scale PV power plants across hail-risk zones by (a) PV plants count and (b) land area coverage
Understanding long‑term hail risk becomes increasingly important, especially if your PV assets are located in areas with higher hail risk.
Hail climatology map in Solargis Prospect, based on physically consistent atmospheric data and machine learning, provides an unbiased view of where damaging hail is most likely to occur over the lifetime of a PV project.
Unlike short-term forecasts, the hail risk map is designed for long-term risk assessment. It shows where hail risk is structurally higher over time, supporting early-stage site screening, project design, insurance considerations, and long-term asset protection.
By combining long‑term hail climatology with short‑term hail forecasts, Prospect users gain a powerful toolkit to reduce risk, optimize design choices, and protect long‑term investments.
If you have any questions or need more information, contact us and we'll be happy to help you.