本页未翻译。您正在浏览的是英文版本。
Great news for our North American clients. From now on, the Solargis Forecast platform provides early warnings for one of the most damaging weather hazards for solar power plants: Hail.
Hail forms as solid ice particles inside powerful thunderstorms. Strong updrafts lift raindrops above the freezing level, where they grow into hard ice stones. These icy bullets fall once they become too heavy for the storm to sustain.
The central United States is particularly prone to frequent hail events. Warm, moist air from the Gulf of Mexico collides with dry, unstable air from the interior of North America, creating ideal conditions for severe thunderstorms, making this region a global hotspot for hail.
Which is why we’re launching this update for the continental United States first, with plans to expand coverage in the near future.
Hail is inherently difficult to predict, but certain atmospheric conditions like strong instability, deep convection and intense updrafts clearly signal a high potential for hail formation.
Solargis Forecast focuses on hailstones that are big enough to seriously damage PV modules. Standard PV modules are tested under IEC 61215 using a 25 mm (~1 inch) ice ball propelled at high speed. This test represents resistance to moderate hail, not extreme events. Hail around 1.5 inches (~38 mm) can generate micro-cracks in tempered glass, leading to latent performance loss. Hail of 2 inches (~50 mm) or more often exceeds certification thresholds and can break the glass, destroying the standard PV module immediately.
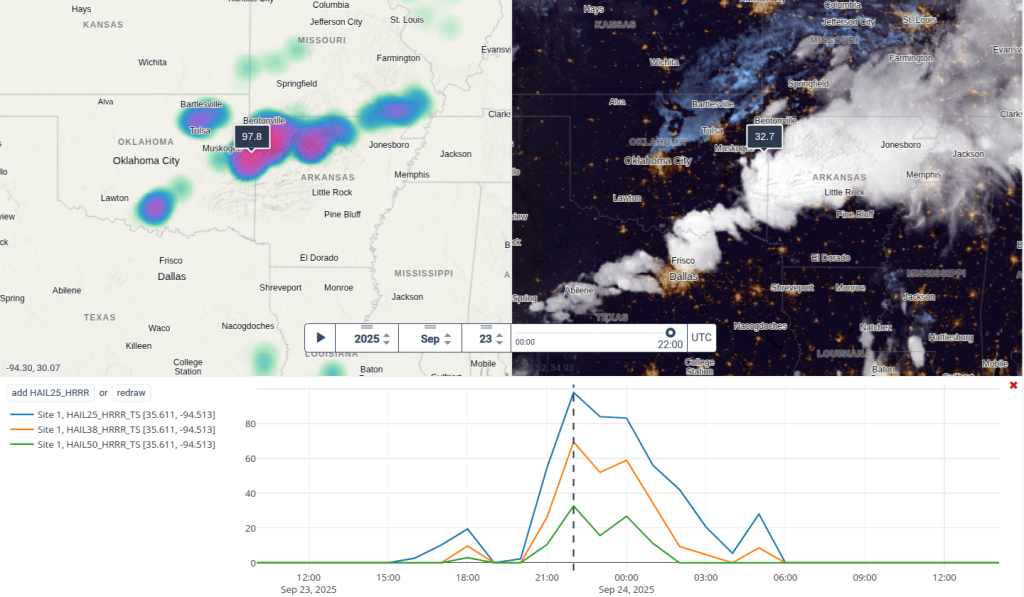
Figure 1: Visualisation of Solargis hail forecast data for central USA on 23 Sep 2025 at 22:00UTC. Map on the left shows potential for hail events [%] with 25 mm (1 inch) size, on the right satellite image from GOES-E GeoColor (NASA GIBS) documenting the extensive atmospheric cyclone. The chart shows the time series of the hail forecast signal for 25 mm, 38 mm and 50 mm size potential at the location marked on the map.
Solargis hail forecast is based on the NOAA High-Resolution Rapid Refresh (HRRR) model. This is a real-time, convection-allowing atmospheric model at 3 km spatial resolution, updated every hour and using radar data to capture storms in real time. We then postprocess the raw grid-level output using temporal and spatial aggregation to better characterize hail risk.
Hail risk is considered higher when several forecast cycles consistently indicate hail in the same time window and when clusters of nearby grid cells all predict significant hail sizes. Because hail is hard to localize precisely, we extend the risk area to about 50 km (31 mile) radius, assigning the highest probability to the hail core and gradually decreasing probabilities toward the periphery.
The hail forecast is available via the Solargis Forecast platform (Professional and Enterprise packages) for the CONUS (continental US – excluding Alaska and Hawaii) region. The range includes southern Canada and northern Mexico too, as per the HRRR model domain. The forecast is updated hourly for subscribed locations, with a lead time of up to 48 hours.
Solargis hail forecast is given in percent [%] for three hail-size thresholds:
Because hail events are highly localized, the percentage indicates the likelihood that a hail event will occur within roughly 3–10 km of the site, and in rare cases up to 50 km.
The reported hail size represents the expected severity of the event. In reality, the largest hailstones are usually confined to very small areas, whereas smaller hail can affect a much broader region. The exact impact point of the largest hailstones cannot be predicted with high spatial accuracy.
Many significant storms occur without witnesses and often go unreported. NOAA’s Storm Prediction Center (SPC) collects and archives observations of hail events across the United States, and these reports form the primary reference dataset for observed hail occurrence and size.
Reporting density varies in space and time and is strongly biased toward populated areas, cities, and major transport corridors. Some regions document hail in far greater detail than others. Despite these limitations, SPC records provide a robust confirmation that hail occurred and offer a useful benchmark for reported hailstone sizes.
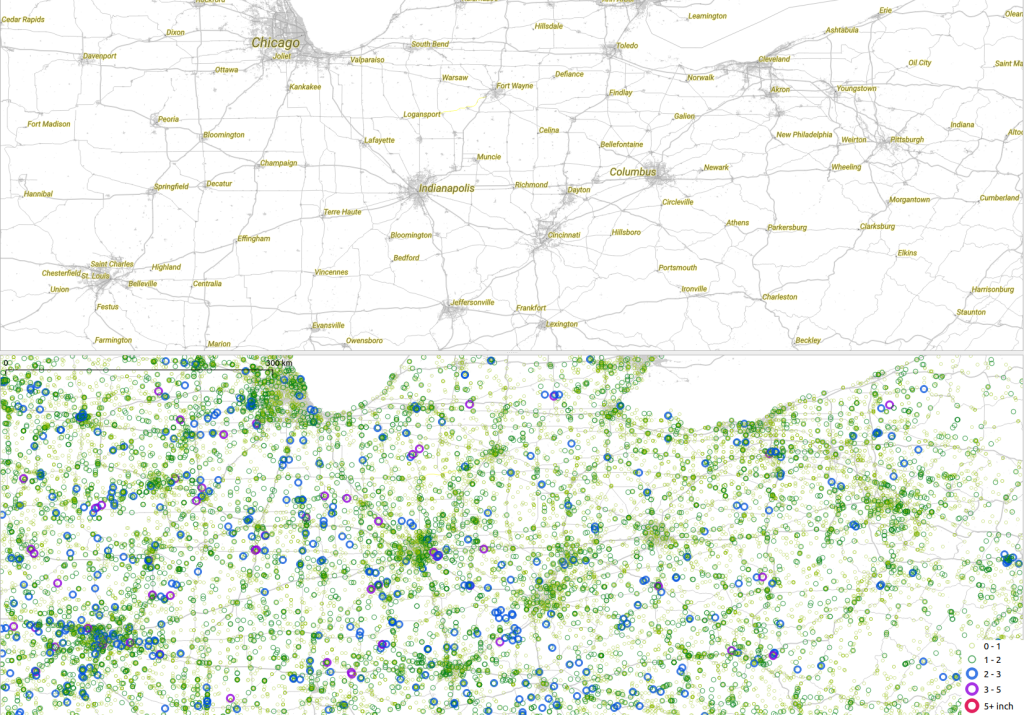
Figure 2: SPC records on observed hail events for a period of 30 years (2004-2023). Density of reported observations correlates with patterns of urban areas and transportation corridors.
We compared our hail forecast with official SPC hail reports from 2021–2023. The results are shown in a 2D binned histogram (Figure 3). During this period, the SPC database recorded 20,905 hail events with hail sizes of at least 1 inch.
The model detected about 94% of these events in at least one forecast run, within a ±3-hour window and a 50 km radius. In practical terms, this means that nearly all damaging hail events would have triggered an early warning in the Solargis hail forecast.
Figure 3: Comparison of SPC events with hail size larger than 1'' in the period 2021-2023 to HRRR model outputs, postprocessed by Solargis method, presented in the density plot. Detailed explanation in the article.
Given the complexity of hail formation, this level of performance is considered very good and gives PV operators valuable time to activate mitigation measures. Around 3.5% of events were predicted as smaller, non-damaging hail, while only about 2.5% were missed entirely.
The difference between forecast and observed hailstone size is more noticeable. The model provides conservative estimates; for moderate hail events (1–3 inches), most points on the chart sit above the 1:1 line, which means the model usually predicts larger hail than what SPC reports. For very large hail (above 3 inches), the model tends to underestimate size, but this is largely influenced by the limited number of data points in that range, due to the fact that such events are quite rare.
On 23 June 2023, a severe evening storm hit Scottsbluff in western Nebraska. Around 9 PM local time (02:00 UTC on 24 June), hailstones, some as big as 4 inches in diameter, struck the site of a 5.2 MWp PV power plant with single-axis trackers, causing extensive damage to most of the PV modules.
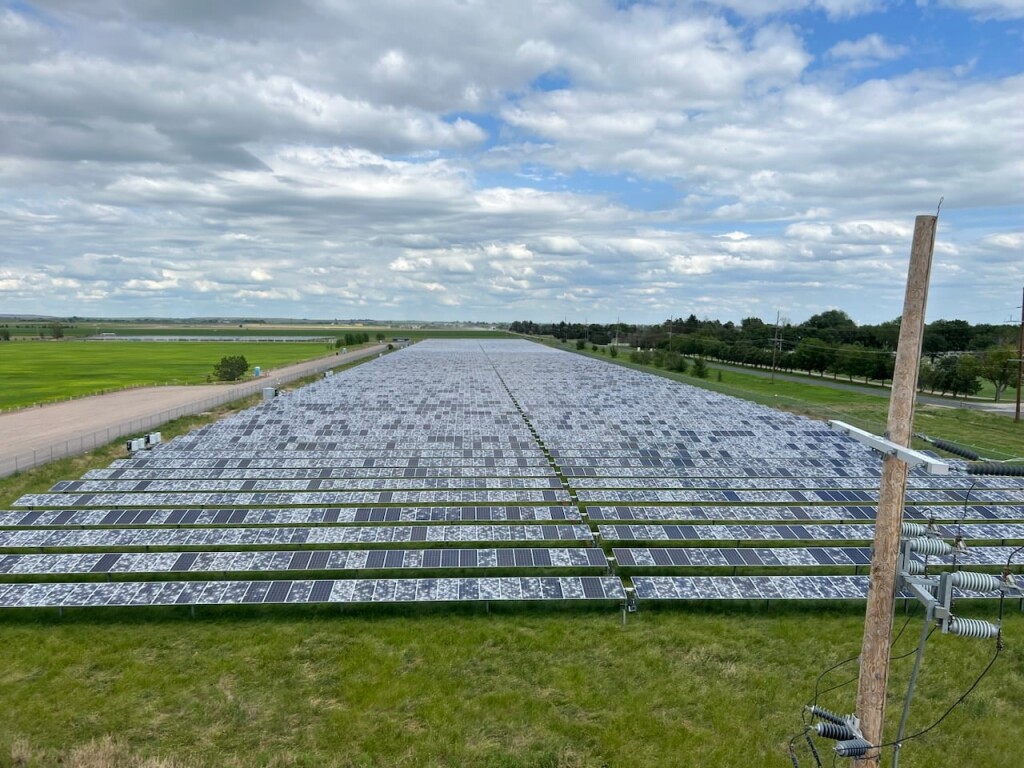
Figure 4: PV power plant in Scottsbluff, western Nebraska after a damaging hail event. Image source: Nebraska Public Power District, taken from Renewable Energy World (renewableenergyworld.com)
The map and chart below show how the Solargis hail forecast model would have captured this event several hours in advance. The forecast signal began to rise approximately three hours before the peak impact, reaching a 95% potential for 25 mm (~1 inch) hail and a 35% potential for 50 mm (~2 inch) hail at the time of maximum impact. Model maxima reached 100% potential for 25 mm and 58% for 50 mm hail in an area located about 20 km northeast of the plant.
Figure 5: Reconstructed Solargis hail forecast for 23–24 June 2023. The Scottsbluff PV power plant location is marked on the maps. Forecast potential for hail exceeding 25 mm (left) and 50 mm (right) at 9 PM local time (02:00 UTC). The chart shows the time series of the hail forecast signal at the plant location.
This case shows how access to short-term hail risk information could have given operators enough time to reduce the severity of damage by adjusting tracker positions. Reports say that the PV modules at the Scottsbluff, Nebraska PV site had to be replaced, before the power plant could return to service in early 2024.
For photovoltaic assets, hail is a serious mechanical risk. It is also one of the costliest weather risks - in terms of hardware cost, lost production and operational disruption. Mitigation starts with system design and access to reliable hail forecasting to provide timely warnings before storms arrive, especially in regions with frequent severe storms, such as the US.
Hail-related module damage is one of the costliest weather risks for PV assets - in terms of hardware cost, lost production and operational disruption. With hail alerts in Solargis Forecast, you gain an early-warning layer that helps you act before the storm hits, protecting your modules, reducing unplanned downtime, and ultimately safeguarding both CAPEX and revenue.
Contact us to learn more.