本页未翻译。您正在浏览的是英文版本。
Soiling has a great impact on PV performance. Dust, dirt, pollen, industrial pollutants, or sea salt obstruct PV modules and reduce solar irradiance transmission, leading to energy losses and higher operational costs.
The impact of soiling depends on local conditions and varies by region, climate, season, and time. Understanding this geographic and temporal distribution is key for accurate yield estimates and effective cleaning planning.
Global soiling maps, now available in Solargis Prospect, give priceless insight into soiling patterns around the world and help PV operators make necessary steps for minimizing their impact.
In Solargis, we developed a global soiling model based on the conceptual approach presented by Coello and Boyle (2019). Their work demonstrated how environmental conditions can be translated into measurable performance impacts.
The Solargis model follows a similar structure, adapting the state-of-the-art physics of particle deposition to the particular case of PV modules and applying it on a global scale using consistent input datasets.
Furthermore, it overcomes the design limitations of the original model (which inherently saturates at approximately 34% loss) by redefining the response to represent regions experiencing severe particle mass accumulation properly.
Soiling loss is quantified by the soiling ratio, which compares the expected energy production of a clean PV module with the output under soiled conditions. We go deeper into the methodology and formulas in this article.
The results are expressed as a percentage of the effective solar irradiation loss caused by accumulated particulates. The model also accounts for the mounting structure and geometry of PV modules as fixed-tilt systems and tracking systems experience different deposition.
Natural cleaning is included as well. Rain events remove a portion of the accumulated particulates, and their effectiveness is driven by the character of the precipitation. Light or short rain events may have a limited effect, while stronger or longer rains can clean the surface more thoroughly and reset the soiling levels.
The Solargis soiling model evaluates each precipitation event based on its intensity and duration, which allows more realistic estimation of how often modules are naturally cleaned.
Input data play a central role in the model.
The two key parameters for estimating particulate deposition are PM2.5 and PM10 concentrations. These datasets are created through a harmonization process that combines several independent sources to ensure consistent global coverage.
Meteorological variables, such as air temperature, atmospheric pressure, wind speed, and rainfall are derived from the ERA5 and ERA5-Land reanalysis datasets (ECMWF and Copernicus).
The resulting metric, i.e. soiling loss, provides a direct measure of the performance impact. It allows consistent comparison across regions and seasons, and helps identify locations where soiling has the strongest operational effect.
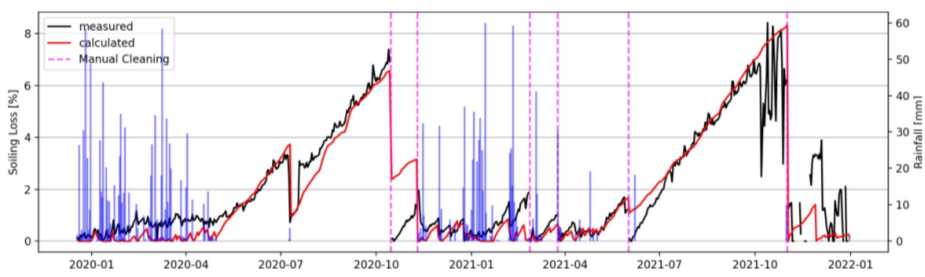
Figure 1: Time series of daily mean values of soiling loss observed and estimated by the model. The daily cumulative rainfall values and manual cleaning events are also shown. Source: https://kb.solargis.com/docs/soiling-losses
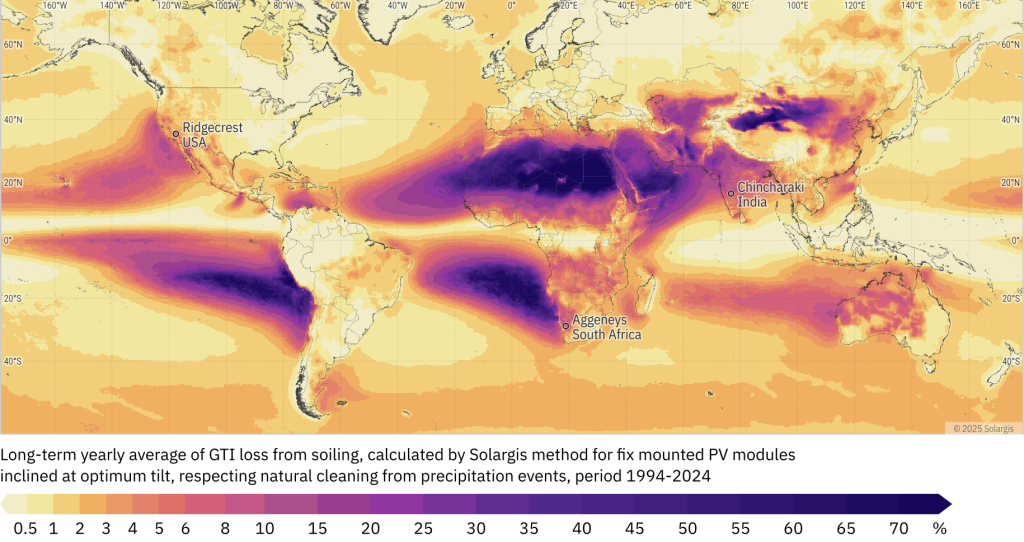
At Solargis, we run the model globally with a daily time step for the period 1994–2024. The resulting map shows the long-term average effect of soiling loss.
It represents the projected reduction of GTI, the global tilted irradiation reaching optimally inclined fixed-mounted PV modules. The values are expressed in percentages and summarize the typical long-term impact of soiling at each location.
The global map shows a highly uneven distribution of soiling intensity.
Low soiling levels appear in regions with limited atmospheric particulate load or with frequent precipitation that provides regular natural cleaning. In these areas, represented by the light colors on the map, the average annual loss of solar resource rarely exceeds 5%. Most of Europe, the Russian Federation, North America, tropical Latin America, and tropical Africa fall into this category.
Other regions experience high particulate concentrations, such as Central Asia, northern India, and eastern China. However, these areas also receive intense seasonal rainfall that partially offsets deposition by cleaning the module surface. Even with this effect, the average yearly soiling losses can exceed 10% and may reach 30% in certain locations.
Figure 2: Global summary map of data from the Solargis soiling loss model.
The highest soiling levels occur in arid zones with persistent dust and minimal rainfall. The Sahara region, the Arabian Peninsula, and the Gobi Desert show the strongest impact. In these areas, represented by the darkest colors on the map, a PV module left uncleaned can lose more than 50% of usable irradiation over a year. Rainfall is infrequent and often weak, resulting in only limited natural cleaning throughout the year.
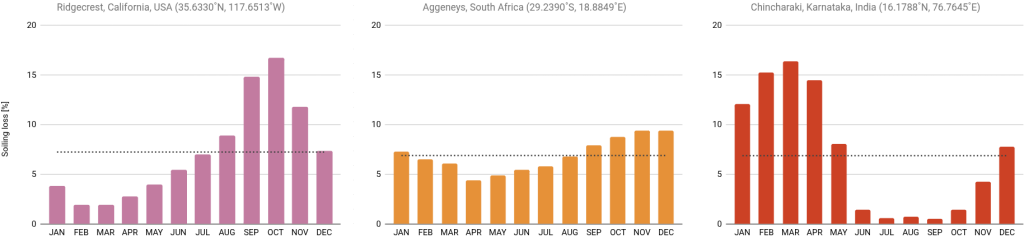
Figure 3: Long-term monthly soiling loss patterns for three locations from various continents (see map above). All three locations have nearly identical annual averages (6.9–7.2%, indicated by a dotted black line). But their seasonal distributions differ significantly, highlighting when cleaning delivers the greatest benefit.
It’s important to note that the map does not account for very local sources of soiling. Human activity such as mining, heavy industry, improper agricultural practices, or simply the proximity to dust roads can cause significant particulate deposition at a local scale.
As a result, locations that appear low in soiling on the map may still experience heavy soiling in practice due to these local effects.
Minimizing energy loss from soiling starts with careful project planning and system design.
Site selection should consider local potential for soiling loss and rainfall patterns. For high-risk regions, using anti-soiling coatings or selecting modules with smooth surface finishes can also reduce dust adherence and improve self-cleaning.
Operational strategies are equally important. Regular monitoring of energy output and soiling ratios helps identify when cleaning is economically justified. Cleaning frequency and strategies can be optimized based on modeled historical soiling loss data and rainfall events. For large-scale installations, automated cleaning systems or robotic cleaners can reduce labor costs and water usage.
Soiling models can help guide decisions on cleaning frequency and overall maintenance. By monitoring the soiling ratio and estimating daily or weekly accumulation, operators can determine when the energy loss justifies cleaning. This allows a data-driven approach that optimizes costs, water use, and labor while maintaining high PV performance.
You can access natural soiling data for PV modules in the Solargis platform at several levels:
1. Global map in Solargis Prospect
Provides projected long-term yearly and monthly averages of natural soiling loss. This map layer helps you understand spatial variability, comparing locations and regions, and analyze typical monthly patterns. It also supports early-stage planning by offering a pre-feasibility view of cleaning needs and strategies.
2. Pre-feasibility PV simulations in Solargis Prospect
Provide the monthly soiling loss levels and support their adjustments.
3. Advanced PV simulations in Solargis Evaluate
Provide visualisation of soiling loss time-series data, PV simulation based on monthly long-term averages and support the manual cleaning events setup
You can also get an elaborated report chapter on potential soiling loss within related Solargis Consultancy services.
If you have any questions or need more information, contact us and we'll be happy to help you.