产品
menu item
Prospect
光伏站点太阳能潜力快速评估
menu item
Evaluate
时间序列与TMY数据用于能源建模
menu item
Monitor
实时光伏输出评估
menu item
Forecast
长达14天的太阳能输出预测
menu item
Analyst
简化统一的太阳能数据管理
menu item
集成
自动交付Solargis数据
使用案例
menu item
选址
寻找合适的太阳能项目位置
menu item
能量产出模拟
分析潜在的收益和风险
menu item
优化电厂设计
寻找最佳电厂设计
menu item
实际电厂性能
探索真实产出
menu item
电力输出预测
预测太阳能项目能量产出
menu item
地面数据验证
验证太阳能与气象测量数据质量
太阳能资源与气象评估
详细的太阳能资源验证与评估
Solargis模型应用于场地适应性调整
结合卫星数据与现场测量数据
太阳能与气象测量质量控制
修正地面测量数据中的错误
定制GIS数据服务
用定制的Solargis GIS数据
光伏能量产出评估
能量估算的不确定性和相关数据输入
光伏性能评估
再融资或资产收购的能量估算
光伏变动性与储能优化研究
理解广泛地理区域内的产出变化
区域太阳能潜力研究
太阳能电厂场地识别
我们的专业领域
我们技术的运作方式
研究方法
我们如何将科学转化为技术
产品指南与文档
发布通知
成功案例
博客
电子书
网络研讨会
出版物
活动
免费地图与GIS数据
太阳能性能地图
关于Solargis
合作伙伴
ISO证书
人才招聘

本页未翻译。您正在浏览的是英文版本。

New generation Solargis Evaluate: data, PV design & simulation, analysis, and reports in one cloud-based solution. Discover more ->

One integrated system for solar project development#

Solargis Evaluate addresses the existing norms of industry-adopted practices by consolidating them into a single cloud-based software solution.

The Solargis platform brings all Solargis products under one roof, offering one environment for solar project development. Solargis Prospect and Solargis Evaluate, both part of the Solargis platform, ensure reliable decision-making from early screening to securing project financing. 

In Prospect, you can explore and quickly assess and compare multiple locations to identify the most promising ones using reliable solar resource data. Once a location is selected, you can proceed to Evaluate, where high-resolution data is used for detailed project analysis and bankability assessments - all without needing to leave the Solargis platform. 

More about Solargis solutions ->

Solargis Home

Access Solargis Evaluate alongside other Solargis solutions through a single, streamlined interface. Manage users and team collaboration seamlessly in one platform. Easily add or remove team members, and onboard new users with just a few clicks, ensuring everyone has the access they need to work efficiently.

Keep track of all your projects through Solargis Home. View your complete project list, see where each project is assigned, track the latest activity, and access everything from a central platform. Filter out your most recent projects, restore archived projects and manage your labels.

More about Solargis Home->


Home page Project List

Within your Solargis Evaluate tier subscription, the purchased credits give you flexibility in your spending. If you are unsure whether you want to use TMY or Time Series data at the moment of purchase, you can decide what dataset you want to use at the time of project activation. 

Once you run out of credits, you can buy additional ones, or if you are left with remaining credits at the end of your subscription period, you can opt to transfer them into your next subscription. This is valid only on condition that you remain in the same subscription plan.

See pricing ->

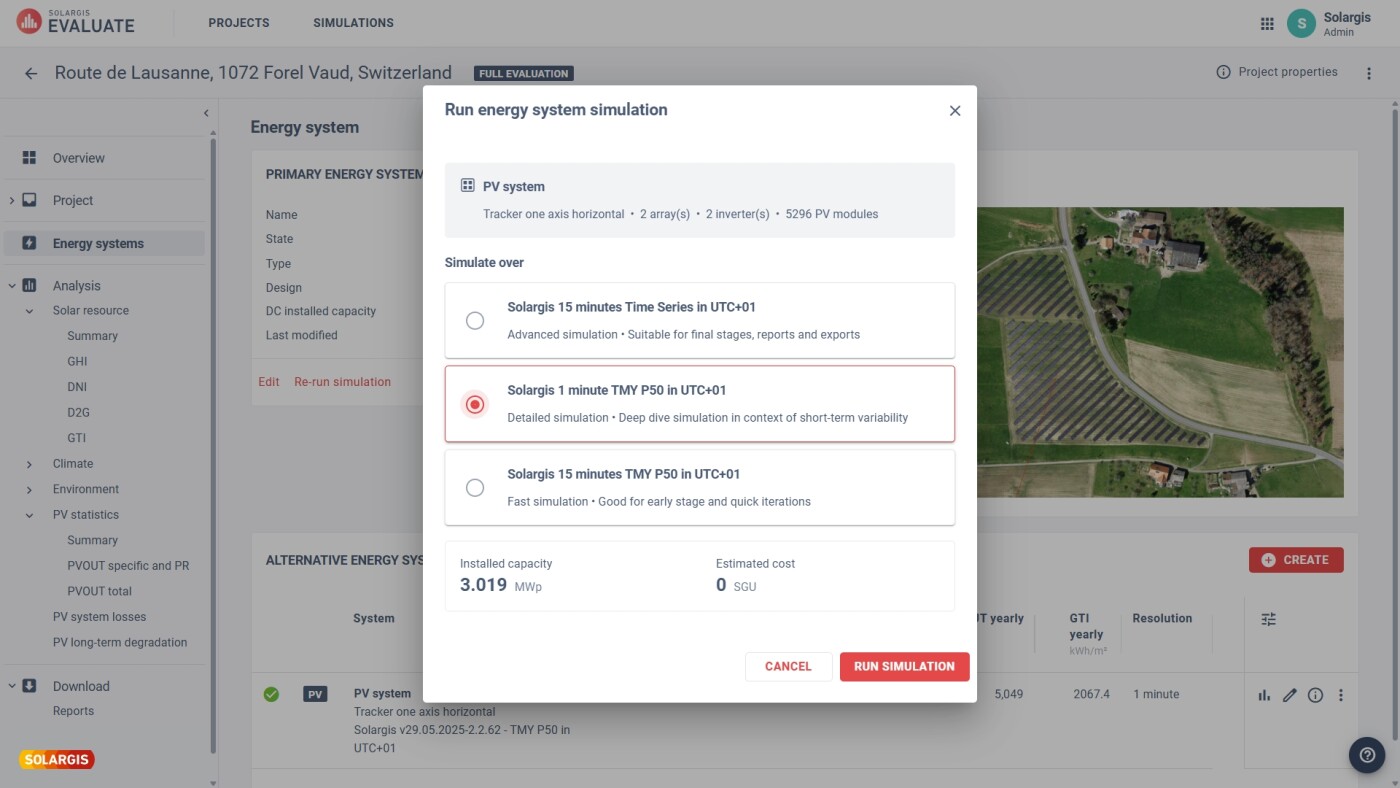
When assessing a location, you can choose to what extent you want to analyze the site conditions. With Solargis Evaluate, you can select between a full evaluation of your project with access to all Solargis Evaluate features, including Time Series data, or get a simple view at your project with a TMY P50 dataset.

Early-stage evaluation
As you enter the initial stages of PV project assessment, you can initiate the “Early stage” phase. This phase marks the beginning of the evaluation process, allowing for preliminary planning to ensure the project's viability.

TMY P50 data allows for a balanced view of expected performance without the need for Time Series data, making it an efficient choice for preliminary decision-making before moving into more detailed, high-resolution analysis.

Full evaluation
When you decide that it’s time to move the project further, you can upgrade to full evaluation any time. In this phase you can work with sub-hourly Time Series data and gain access to the full suite of Solargis Evaluate features, such as generating bankable reports that help with securing project financing. 


Evaluate overview activate project

Within our platform, you can now request consultancy services or additional data services directly, saving time on email communication and file exchanges as the project data is already included in the request. 

You can directly request

  • Data services:

    • Special resolution data: 1-, 5-, 10-minute data
  • Consultancy services: 

    • Enhanced Solar Resource & Meteo Assessment
    • Site Adaptation of Solargis Model Time Series Data
    • Ground Surface Albedo Time Series
    • Enhanced PV Energy Yield Assessment
    • Ground Surface Albedo Evaluation Based on Site-Adapted Data

Additional services reduce the uncertainty of PV power plant design and increase your confidence in the project's long-term viability. Attract investments by achieving more accurate financial estimates and increase the credibility of project evaluation. 

More about consultancy services ->

Evaluate overview request consultancy

Solar, meteorological and environmental data#

Use the finest data available for building sound financial plans. Solargis Evaluate works with data always ready to provide accurate irradiance inputs for your project sites.

Solargis provides solar and meteorological data within latitudes 60 S and 65 N.

All land is covered except polar areas.

At the moment of project activation, Solargis Evaluate generates Time Series for the available historical period up to last month, so that you are working with the latest data available.

Long history of data includes typical weather as well as anomalies. Every new data request benefits from the latest model improvements in accuracy.

More about data coverage ->


Solargis EVALUATE data coverage map

Solargis offers the most extensive validation based on publicly available solar data coming from high-end, quality-controlled pyranometers and pyrheliometers.

We are committed to transparency by publicly disclosing the detailed results of the validation in the Solargis Validation Report.

At the same time, we are continuously adding new validation sites all around the world to make sure that our solar models perform according to our high standards globally. 

More about solar model validation ->


Extensive ground validation

Enhance the resilience of your PV design by accounting for extreme weather with 15-min data and optimize for the best PV performance. By default, Solargis Evaluate works with 15-minute Time Series data referring to a history of up to 30 years, including all meteorological and environmental factors relevant for PV energy simulation and analysis. 

Using 15-minute Time Series data for PV power plant design captures high-frequency variations in solar and weather conditions. This leads to more accurate modeling of power output and helps optimize PV power plant technical components. 

As a result, the simulation accounts for both short-term fluctuations and long-term variability, optimizing the power plant design to meet the business model requirements and withstand extreme weather. 

By using the full history of data, you can adapt the PV design to account for short-term variability and long-term trends, while grasping the effects on future conditions, ensuring the system is resilient to potential shifts in temperature and other conditions. 

Weather variability

PV design - Energy System Designer#

Create a digital twin of the future power plant using the most advanced and detailed PV energy system designer available. 

When designing a PV power plant, it is possible to choose from multiple terrain models that lead to different layouts:

  • Copernicus in 30m resolution (1 arcsec | global | 2011-2015 | surface model - including trees and buildings)

  • SRTM (Google Earth) in 30m resolution (1 arcsec | global | 2000 | terrain model - excluding trees and buildings)

  • SRTM (Solargis) in 90m resolution (3 arcsec | global | 2000 - 2017 | terrain model - excluding trees and buildings)

Experimenting with different elevation data results in different energy yields, but doesn’t affect solar and meteorological data. Horizon shading is calculated from the environmental data and depicts the terrain elevation and shading in the location’s surroundings. You can modify and enter your own horizon data if needed. 

More about the importance of terrain data ->

The advanced energy system designer allows you to design the PV array layout, including mounting selection, tilt, and rack spacing. Additionally, the PV energy design supports multiple mounting types at once. 

Below you can find the list of mounting types that Solargis Evaluate supports on horizontal or inclined plane: 

  • Fixed angle
  • Tracker one-axis NS with adjustable azimuth 
    • Backtracking
    • Rotation limits
  • East-west mounting

More about array configuration ->

When the array is populated with PV modules, the Energy System Designer automatically calculates optimal tilt, azimuth, row spacing, and other relevant settings. The proposed configuration represents the optimal PV design settings tailored to the selected location, mounting type, and local climate.


The 3D interactive scene enables viewing the system from various angles and perspectives, providing a clearer understanding of the layout in a geographical context and potential issues.

You can define different types of objects, such as buildings, trees, hedges, and other physical elements that might affect the solar power plant layout. 

By using restricted line tool you can draw the service line and define its width, which allows for the placement of inverters into these safe zones. 

Line objects can be used to draw any objects that impact the shading of the PV power plant and their height can be defined up to 500m. 

If you have defined these objects using a different tool, you can simply import them in a KML format. It is possible to import segments (non-overlapping polygons), restricted areas (overlapping polygons), and shading line objects (polylines).

More about service lines, restricted areas, and line objects ->

The capabilities of the energy system designer go beyond a simple 3D design and selection of PV hardware. Our PV design incorporates advanced settings for electrical layout, including inverter setup, placement of transformers, and defining cabling losses. 

The system automatically selects the most appropriate generic PV modules and inverters and intelligently places transformers. It lets you manually define factors like cabling, degradation, and environmental losses. 

If you have a preferred model of a commercial PV modules or inverters, you can directly pick specific models from the PV Components Catalog. You can then optimize the position of the inverter according to the limitations of the location. You can tailor it to your project’s power output, efficiency, module compatibility, and unique requirements of your project. 

Detailed information about each inverter option is provided, including technical specifications and performance data.

More about inverter configuration ->

The built-in validation tool checks for potential problems like voltage mismatches, incorrect inverter settings, or grid connection issues. This feature helps you identify and fix issues before energy simulation.

By ensuring all components work together correctly, the validation process increases system reliability and improves performance. All attributes of the energy system validator must be defined correctly to run a PV simulation. You can check the status of the validator anytime during the design process and adjust what is needed.

More about energy system validation ->

Evaluate Energy System Designer Validator

PV Components Catalog#

Solargis Evaluate is integrated with a searchable online PVCC database of verified PV components from manufacturers all around the globe. It lets you source reliable specifications for PV components to ensure accurate layout and energy yield simulations.

Developers can trust that the PV components’ specifications have been verified by the Solargis algorithms and experts as they adhere to a transparent set of verification steps. A dedicated team manages the catalog, ensuring it is maintained and well-organized through active collaboration with manufacturers, laboratories, and experts.

More about the component validation ->

The information in the PV Components Catalog is traceable, allowing solar developers to know when the file was created, when it was last updated, and more. The database includes current components' specifications and historical data for previous models.

More about component review process ->


PV Component Catalog 2

Our PV Components Catalog contains a wide range of technical data on inverters and PV modules, allowing you to customize your power plant with industry-standard components for realistic and efficient system designs in Solargis Evaluate.

Didn’t find the component you are looking for? The PV Components Catalog allows you to import technical parameters of your own components.

Seamless integration with data stored in PVcomponents.com lets you add your components to the list and use them in your PV design in Solargis Evaluate.

More about PV component creation ->

PV Component Catalog

PV energy yield simulation#

Our PV simulator utilizes a real-world model and ray tracing simulation, ensuring reliable data and accurate results. It's an essential tool for solar engineers seeking optimal PV energy performance. 

The Solargis PV simulator is built on scalable cloud infrastructure with intelligent preprocessing capabilities. The simulation engine delivers high precision in computation, while maintaining high accuracy of the results. Additionally, it supports parallel simulation requests, enabling multiple scenarios to run simultaneously. 

Most importantly, Solargis Evaluate does not block your hardware resources, allowing you to work simultaneously on multiple tasks without interruption.

More about Solargis information security ->


PV sim queue

Solargis PV simulation uses ray tracing technology and anisotropic sky model.

It considers all kinds of shading defined by both horizon data in the Solargis data model and shading objects present in the physical world model. The precise path of sunlight is simulated by tracing individual rays between the sky and solar cell surfaces as it travels through the 3D environment.

The ray tracing algorithm is based on Monte Carlo backward path-tracing, where we trace back the source of light to each cell and take into account multiple bounces until the source of light is reached. This is validated with bifacial_radiance.

3D ray tracing-based simulation allows us to calculate for hilly terrains and bifacial panels with no limitation. 

Ray tracing delivers more accurate results by leveraging detailed geometric information about the scene and precise calculations for each ray. This provides exceptional precision in simulations, although with greater computational effort compared to the faster but less detailed view factor method.

Evaluate raytracing V9 clear 1

In Solargis Evaluate we approach PV system losses in greater detail. Our systematic approach to PV system losses starts by dividing them into optical and electrical parts. By methodically addressing each type of loss and employing robust calculation methods, we provide a comprehensive and reliable estimate of the expected energy output based on the actual power plant definition. 

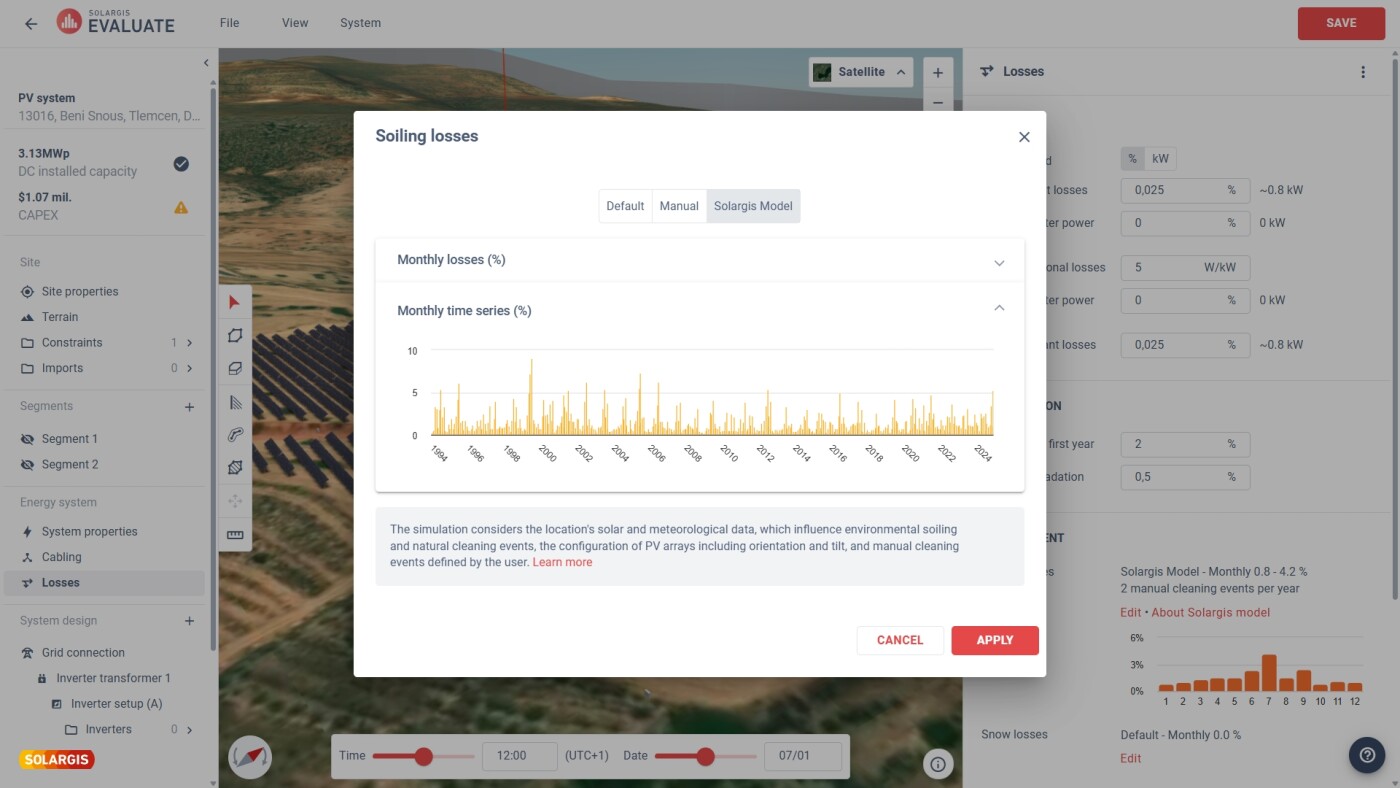
We provide monthly breakdowns of PV system losses by category, providing seasonal and interannual variability of monthly PV losses. This helps in making informed decisions about component sizing (e.g., inverter capacities) and PV system configurations to accommodate seasonal peaks and decrease stakeholders’ financial risks.

Some examples of the PV losses we take into account include: 

  • Shading losses
  • Spectral losses 
  • Inverter losses 
  • Conversion losses
  • Angular losses
  • Auxiliary losses
  • AC cable losses

More about PV system losses ->

Evaluate Analysis PV Loss Seasonal

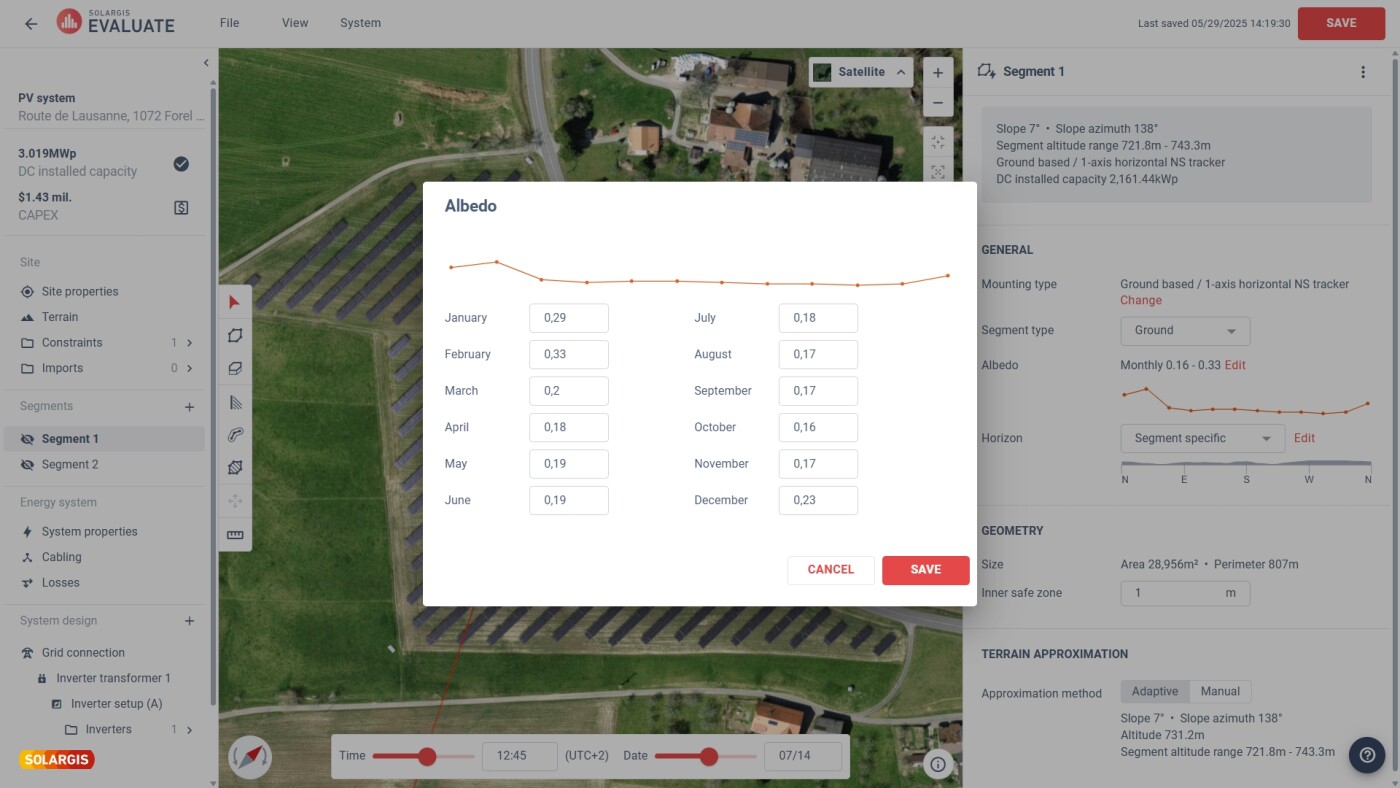
The ground's surface albedo influences the amount of sunlight that reaches the solar modules, particularly in utility-scale solar installations, where the spacing between modules allows sunlight to hit the ground.

Ground surface albedo becomes especially important when bifacial PV systems are installed. 

Understanding albedo can lead to higher energy yields, making it an important consideration in the design of bifacial PV systems.

Our approach uses a sub-hourly Time Series of solar radiation and in-house calculated albedo data, making it possible to capture the short-term variability in front and rear-side solar radiation received by PV modules throughout the day. 

This approach, combined with ray tracing technology that accounts for factors such as shading from torque tubes, provides a more accurate simulation of how reflected light interacts with bifacial modules. 

The energy system designer allows for adjustments to ground surface albedo settings to reflect ground reflectivity as a whole, or separately per every segment with monthly granularity.

More about albedo ->

Evaluate Energy System Designer albedo

Early-stage evaluation with TMY: TMY data aggregates historical weather patterns into a "typical" year, providing a reliable representation of average solar radiation, air temperature, and, to a lesser extent, wind speed. For early-stage project evaluation, TMY data offers a quick and cost-effective means of estimating solar and PV potential. This makes it useful during the pre-feasibility phase, where developers need to perform high-level assessments to determine the viability of a project.

However, TMY data is far from perfect. It smooths out significant weather fluctuations, and its low granularity—typically in hourly time step —fails to capture critical types of variability. These include:

  • Short-term variability (intra-hourly fluctuations)
  • Interannual variability and seasonal changes
  • Long-term variability and climate change

The primary limitation of TMY data is its failure to capture extreme weather events like storms or high winds, which can disrupt solar generation. By averaging these extremes into typical patterns, TMY underestimates real-world variability and leads to overly optimistic performance predictions. 

Full evaluation with Time Series data: As a project moves from the early stage into full evaluation, it is crucial to transition from TMY data to high resolution Time Series data. Unlike TMY, Time Series data is typically available in 15-minute intervals, covering periods of up to 30 years. This resolution provides developers with a much more granular, accurate representation of weather patterns and variability, allowing them to simulate solar power generation in real-world conditions with far greater precision.

For example, high resolution data captures the impacts of extreme weather events like cloud cover, high winds, air pollution, or snow. These events, which are often overlooked in TMY-based simulations, can have significant consequences for energy generation, system performance, and project financials.

The contrast in data volume between TMY and Time Series is evident:

  • TMY typically offers around 8,760 data points per year (one per hour)
  • High resolution data, by comparison, provides over 1 million data points per year (at 15-minute intervals)

More about TMY and Time Series data ->

Datapoints comparison graph

Data analysis#

No need to perform your own data analysis or visualizations in 3rd party tools. With our extensive data analytics section, you will gain access to a collection of various charts and tables providing a great overview of the site’s solar, meteorological, and PV power potential.

Deep dive into Global horizontal irradiation, Global tilted irradiation, Direct normal irradiation, and Diffuse horizontal irradiation, presented in charts and tables in yearly, daily, hourly, and sub-hourly resolutions.

Understand your project’s solar data and analyze the variability of the solar resource over the full period of satellite data retrieval.

More about solar radiation modelling ->

Evaluate analysis solar

The charts detailing parameters such as air temperature, precipitation, ground surface albedo, and precipitable water, with data presented in graphs and tables at yearly, monthly, and hourly resolutions provides insights into the site local conditions.

For example, to help identify strong winds that may limit operation or threaten the structural integrity of the PV system, wind parameters, including wind direction and wind gusts, are provided within the delivered data.

More about meteorological models ->

Evaluate analysis meteo

Thanks to the fact that model inputs start from 1994, there is enough data to calculate the expected interannual variability for the site conditions.

Accounting for interannual variability lets you create designs that can withstand extreme weather. Moreover, it will significantly mitigate inaccurate estimates, enhancing the resilience of design and lowering the risk of overestimated financial returns.

More about interannual variability ->

Evaluate analysis interannual

Besides the theoretical specific and total photovoltaic power output, we calculate the Performance Ratio (PR), which is based on the EIC 61724-1 standard. This is to help you understand the maximum potential of your PV design and set reasonable expectations for operational targets. 

The PV statistics section includes charts and tables for theoretical photovoltaic power output values, which can be found in yearly, daily, hourly, and sub-hourly resolutions. This helps with informed decision-making, accurate budgeting, and proactive management to optimize energy production and mitigate risks.


Evaluate analysis PV

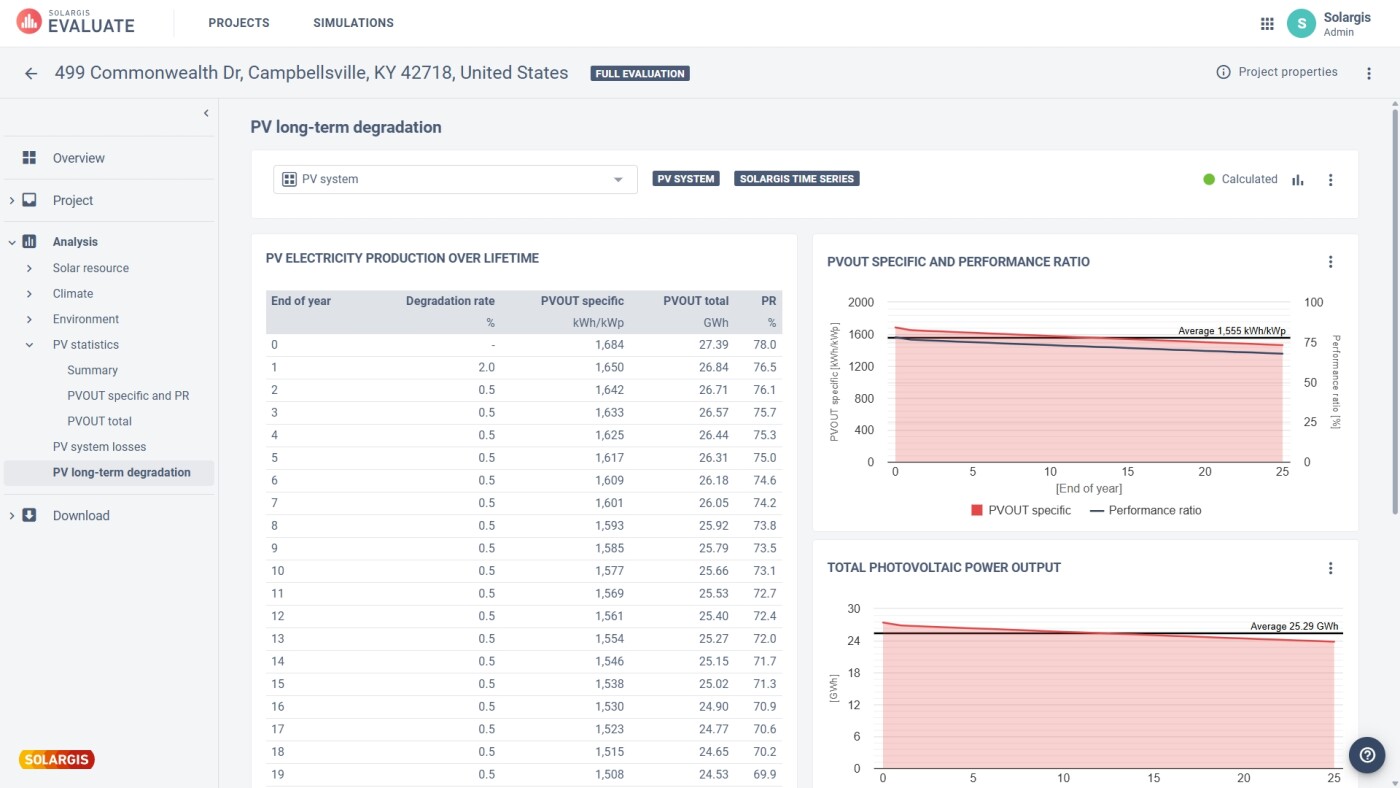
PV performance degrades by some percentage every year. The degradation rate depends on factors such as module type, system design, environmental conditions, and maintenance practices.

We provide a year-by-year breakdown that enables you to assess your system’s performance over its lifetime. The calculations incorporate the user-provided degradation rate, offering a more accurate estimate of the system’s PV energy yield.


Evaluate Analysis PV degradation

For key parameters such as GHI, DNI, GTI, and PVOUT we provide monthly histograms in up to 15-minute resolution. The combination of histograms offers a richer, multi-dimensional perspective on solar system performance, leading to improved long-term estimates, performance optimization, and variability insights of a PV energy system.

Monthly histograms offer valuable insights into the high-frequency fluctuations of solar radiation throughout the day, providing insights into the variability of solar power delivered to the grid. This analysis helps manage the risks associated with limited capacity of grid to absorb this variation.

Frequent variability of PV output may also result in higher energy losses due to the design of inverters and strings. High-frequency variability and technical limitations of PV components are considered in the PV simulation and reflected in the section on PV losses.

Features analysis signed

Bankable report and customizable exports#

With Solargis Evaluate you can generate reports and store them in one place. Get consultancy-grade reports for your site - making it easier than ever to assess PV potential and secure project financing.

A technical note is designed to be only a preliminary report. It is based on the TMY P50 data and is typically generated during the early stage of the project development. 

The PV simulation technical note includes a yearly and monthly analysis of solar energy potential and climate parameters, based on TMY data.

Sample reports and data ->
This extensive report is based on a Time Series energy system data, primarily calculated by models using satellite, meteorological, and environmental input data. This report evaluates the long-term power production potential for any solar power plant design.

Sample reports and data ->

The energy system designer helps you prepare alternative designs for a PV energy system. 

The energy system summary provides a comprehensive view of the technical details of a PV configuration.

Sample reports and data ->

Solargis Evaluate works with data representing a history of data available form meteorological satellites and synchornized with data from meteorological models. The data is delivered in industry standard formats, which are used by PV energy yield simulators.

Apart from Solargis standard formats in JSON and CSV, we support commercial formats, such as PVsyst, NREL SAM, and HelioScope.

Sample reports and data ->