本页未翻译。您正在浏览的是英文版本。

Marcel Suri
Jun 25, 2025
As solar projects grow more complex, so does the need for high-quality solar and meteorological data capable of delivering the highest possible accuracy in PV simulations. While Typical Meteorological Year (TMY) datasets have long served as a trusted industry standard, their limitations are becoming increasingly evident – not only for complex, utility-scale developments, but even for simpler projects.
TMY datasets are still useful for early-stage, pre-feasibility assessments. However, they are no longer sufficient for performance modeling and financial analysis.
Today, we’re no longer constrained by the computational limits or data scarcity that held us back in the past. Thanks to satellite-based models and advances in cloud computing, high-resolution datasets are now at our disposal. And when more detailed data is readily available, why rely on an outdated standard?
Just as we once moved from low-resolution to ultra-high-definition TV screens, the solar industry must now make the same leap and embrace high-resolution time series data as the new standard.
Most industry models available today still rely on hourly TMY, which aggregates historical data into a synthetic “typical” year, smoothing out natural variability and ignoring day-to-day and year-to-year weather fluctuations that affect real PV system behavior. As a result, TMY is not able to reflect the usual variability of weather conditions and fails to provide a reliable basis for simulations.
For example, sudden drops or fast changes in solar radiation may come as an unwelcome surprise and cause a drop in production and thus revenue and profit. For this reason, developers need data with a shorter time resolution than hourly, to be able to better predict these events and prepare for high-frequency changes of weather.
In contrast, time series data takes into account each actual year over the past, for instance, 30 years. In the case of the 15-minute time series (TS), each individual year is further broken down into 15-minute intervals, better accounting for extreme weather events and offering site-specific data at an unprecedented level of detail.
15-minute time series data is thus a more viable alternative to TMY because, by addressing weather variability, they improve the overall accuracy and reliability of PV simulations.
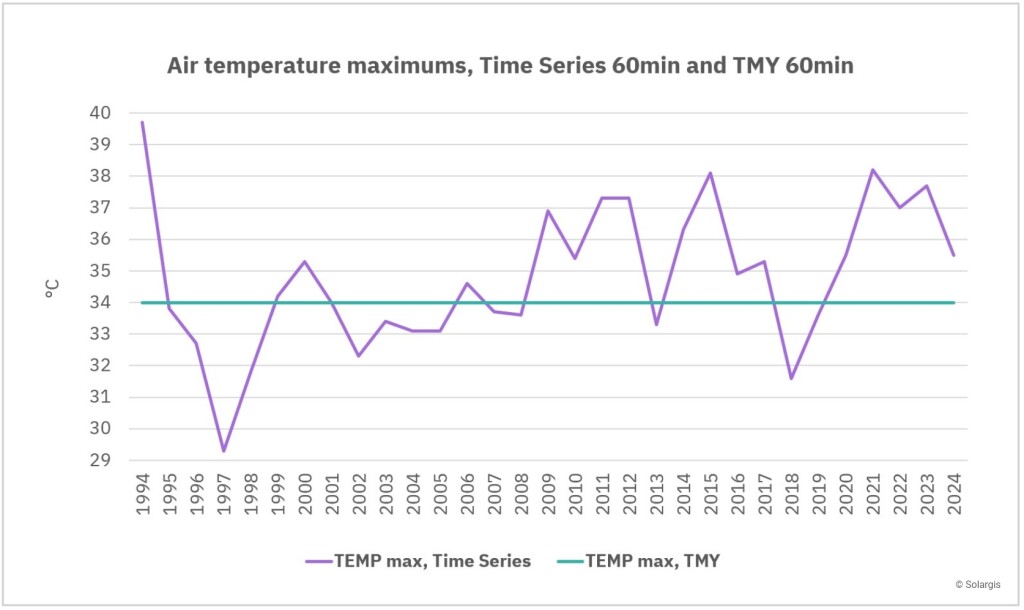
This figure shows maximum air temperatures over the course of 30 years (1994–2024) as represented by hourly TMY and hourly TS data. While the TMY dataset shows an averaged value of 34 degrees Celsius, the higher-granularity time series data provides a more realistic view of the actual solar and meteorological conditions for each year.
To further illustrate the impact of data granularity on PV simulations, let’s compare how Long-Term Average (LTA), TMY, and TS datasets represent the same period.
Long-Term Average (LTA) data assumes that every day in February is identical each year – sunny, cloudless, and with no variability in solar radiation. This doesn't provide a sufficiently accurate assessment of PV performance, as real weather in February can include overcast conditions, rainfall, temperature swings, and irradiance instability caused by moving clouds.
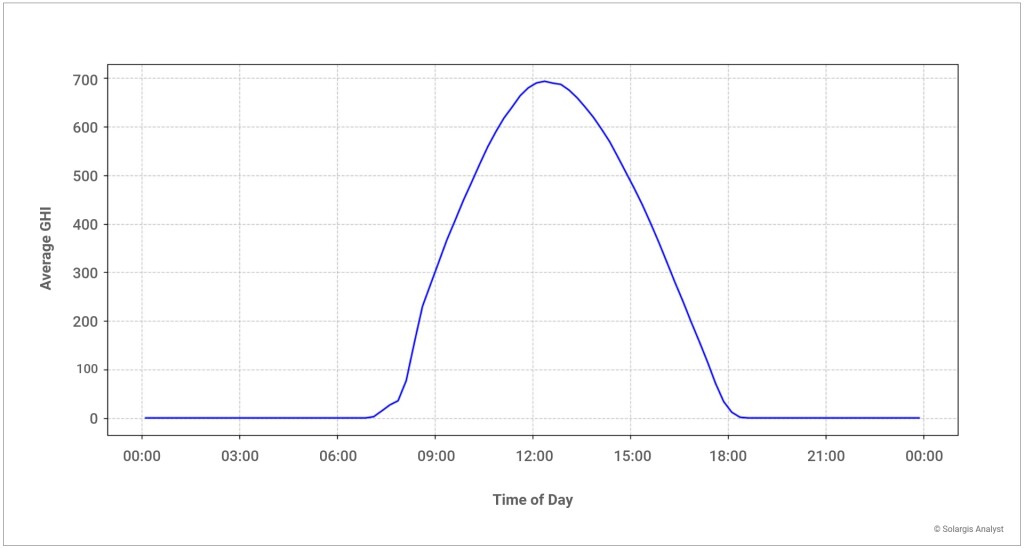
Long-Term Average (LTA) monthly data for February. Source: Solargis Analyst.
If TMY is synthetically generated from LTA data, it introduces some variability – but it is artificial. The error margin compared to actual conditions can easily reach 10%. Moreover, inconsistencies between key variables such as GHI and temperature can result in unrealistic scenarios – for example, low GHI with high temperature – ultimately leading to underestimation of PV output.
Running PV simulations with hourly TMY data means assuming that all February days across all years can be represented by a single set of 28 “typical” days.
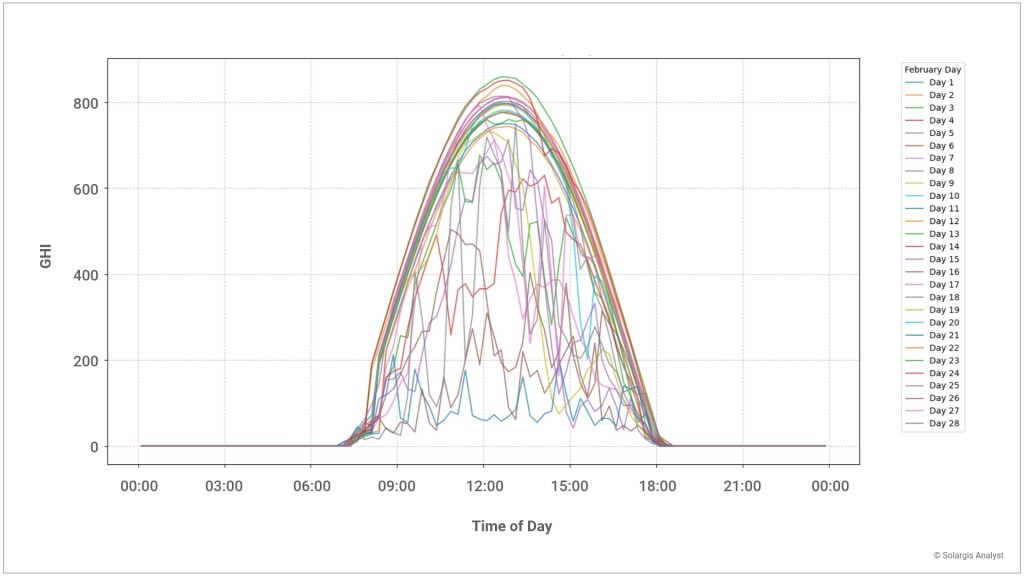
Hourly Typical Meteorological Year (TMY) data for the month of February. Source: Solargis Analyst.
TMY allows for some variability of weather in February, although it only covers 28 instances (28 days). But you can already consider days, when GHI exceeds 800 W/sqm (where the LTA assumed GHI reaches maximum of 700 W/sqm), or when it is overcast and GHI does not even reach 200 W/sqm. You also consider the variability of GHI due to moving clouds.
By contrast, Time Series (TS) data captures the full spectrum of historical variability. It accounts for every actual February day across the 30-year period – more than 800 February days – offering a detailed representation of solar conditions, including rare and extreme scenarios.
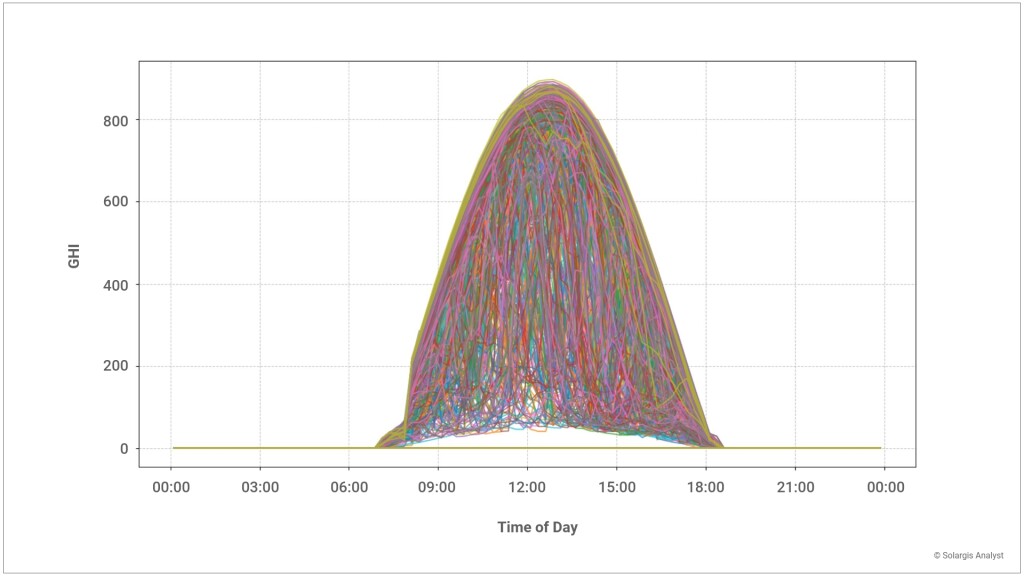
Time Series (TS) data for for every actual February day across the 30-year period. Source: Solargis Analyst.
Where TMY-based simulations often produce overly optimistic predictions and suboptimal system designs, time series data enables a realistic understanding of how a PV plant will perform under a wide range of real-world conditions. It provides the foundation for accurate expectations in operations, maintenance planning, and economic modeling.
Expressed in the number of data points, the granularity difference is significant. While most industry models that rely on hourly TMY data provide 8,760 data points per year (24 hours x 365 days), 15-minute TS data over a 30-year period offers 1,051,200 data points (30 years x 8,760 hours x 4 intervals per hour) – delivering 120 times more useful information than TMY.

Comparison of data points per parameter of hourly TMY, 15-minute TMY and 15-minute Time Series data.
Working with over 1 million data points per parameter – compared to 8,760 in traditional TMY-based models – enables not only significantly improved energy yield simulations but also more robust financial modeling and greater bankability. The move to Time Series data is not just a technical upgrade; it is critical to improving ROI, securing financing, and delivering reliable long-term PV performance.
Accurate PV performance modeling is one of the most crucial aspects of securing funding for solar projects from banks and investors. The increased weather variability paired with a more competitive energy market, and the volatile value of electricity has made financial stakeholders raise their standards. Today, banks, investors, and insurers require more rigorous, evidence-based assessments of energy yield and operational risks. Projects that rely solely on TMY data often fail to meet these expectations.
Because of the higher frequency and severity of extreme weather events – along with the damage they cause to assets and energy production – developers must consider the potential losses from the extreme weather events and the likelihood of their occurrence. These are, after all, core concerns for financial institutions and insurers.
Lenders are under pressure to scrutinize projects more thoroughly, especially as insurance premiums spike in response to climate-related losses. In 2024, renewable energy insurance premiums increased by 20% to 40% compared to the previous year. This reflects a growing realization that low-resolution forecasts are failing to anticipate underperformance or equipment failure during high-impact events.
Since TMY data doesn’t accurately capture the frequency or impact of extreme events – such as heatwaves, storms, or prolonged cloud cover – models based on TMY systematically underestimate risk exposure and overstate performance consistency.
By contrast, time series data provides several strategic advantages:
More accurate loss modeling: Developers can simulate equipment stress, curtailment risks, or production variability under realistic weather extremes.
Improved due diligence: Financiers gain access to detailed energy yield predictions, helping them understand best- and worst-case scenarios.
Greater transparency and trust: A model built on harmonized, physics-based Time Series data can be validated, audited, and replicated – critical requirements for institutional investors.
Alignment with insurance requirements: High-resolution modeling supports more robust risk assessments, enabling more favorable insurance terms and reducing coverage denial risks.
Ultimately, PV projects must now compete not only on capacity and LCOE, but on credibility. A solar plant that performs well in theory but fails in the real world will no longer satisfy the financiers. As investors become more risk-aware, the industry must raise its data standards accordingly. That means moving beyond TMY – and embracing high-resolution Time Series data as the new foundation for PV project evaluation.
At Solargis, our mission is to bring scientific rigor, transparency, and greater accuracy to solar project modeling. We built Solargis Evaluate around that principle.
By default, Solargis Evaluate uses 15-minute Time Series data spanning up to 30 years to simulate PV performance with unparalleled accuracy. This enables developers to better model inverter behavior and design systems resilient to sudden condition changes. Grid operators and developers can effectively anticipate real-time performance variations, reducing the risk of failing to meet the energy demand requirements set by contracts with energy offtakers, as well as minimizing instability in PV plant operations.


