Participa en nuestro próximo seminario web «¿Se puede confiar en los datos medidos?», que tendrá lugar el 27 de octubre de 2026 a las 10:00 h CET. Inscríbete aquí

Marketa Hulik Jansova
Oct 22, 2026
Ground-measured solar data is often treated as the ground truth. It is used to evaluate PV plant performance, validate models, adapt satellite-based datasets to local conditions, calculate expected production, and assess whether an asset is performing as it should.
But measured data is never perfect.
Instrument faults, installation issues, environmental effects, soiling, shading, calibration drift, and sensor misalignment can all introduce errors. Some are obvious. Others are subtle and can remain hidden in the data for months.
The problem is not only that these issues exist. The real problem is that they silently distort every result built on top of the measurements.
This topic was the focus of a Solargis study that we presented at PVPMC 2026, looking at the impact of quality control on uncertainty in solar PV performance evaluation. For the analysis and quality control of measured data, we used Solargis Analyst, our software for visualizing, comparing, cleaning, and analyzing solar and meteorological data.
Our analysis quantified the full chain from raw measurements to final performance metrics, with three practical questions:
The results we presented were clear: Quality control is not optional. It is a necessary step before measured data can be used with confidence.
Our first finding is perhaps the most important one. In the dataset we analyzed, 100% of GHI and GTI time series contained quality issues.
We evaluated 509 GHI and 77 GTI ground-measurement datasets using Solargis expert quality control procedures. The study looked at both the occurrence of quality issues across datasets and their impact on Bias and Mean Absolute Error (MAE) when left uncorrected.
In a typical dataset, the proportion of affected data points was relatively low. Median affected data points reached 3.2% for GHI and 6.1% for GTI.
But the tail of the distribution was much more severe.
At the 90th percentile, affected data points reached 18% for GHI and 15% for GTI. Persistent calibration or misalignment issues could affect up to 47% of all data points at P90.
This means that the median dataset may look manageable, but difficult cases can be seriously compromised. If quality control is not performed, there is no way to know where a specific dataset sits in this range.
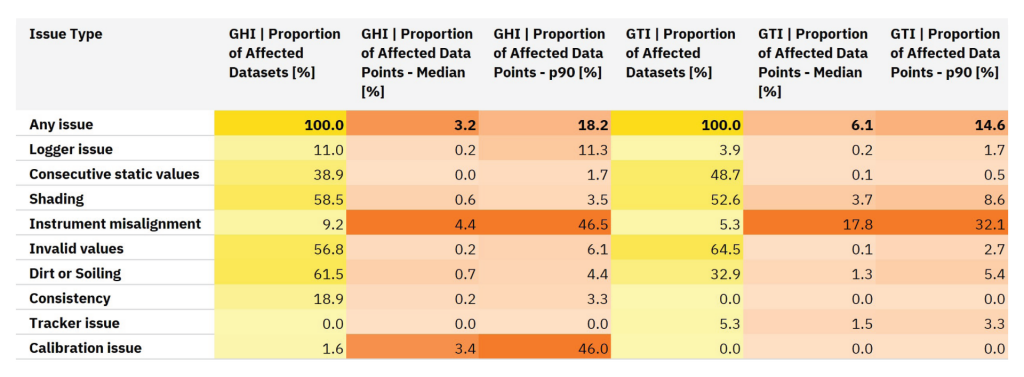
Table 1: Share of affected datasets and data points per selected quality issue type, for GHI and GTI. Note: Affected data point statistics are computed only from datasets where the respective issue is present.
Quality issues do not need to affect most of the dataset to matter. Even a relatively small number of problematic data points can increase uncertainty, especially if the issue introduces systematic bias rather than random noise.
Our analysis showed that leaving all quality issues unflagged amplified Bias by 5.7% for GHI and 4.6% for GTI at P90, with similar increases in MAE.
For PV performance evaluation, this matters because many decisions depend on small differences. A few percent of bias can influence whether an asset appears to underperform, whether a model appears accurate, or whether the expected and conservative production scenarios are properly understood.
In other words, measurement quality issues can enter the analysis quietly, but their effect can be large enough to distort the interpretation of performance.
This is why the safest starting assumption is simple:
Assume your measured data contains quality issues, because it almost always does.
In the second part of the study, we looked at automated quality control.
Automation is essential because manual review of large, high-resolution measurement datasets does not scale easily. PV projects can generate large volumes of data, especially when measurements are recorded at one-minute or five-minute resolution across multiple sensors and long periods.
Our study analyzed 114 one-year datasets, each with two GHI measurements and expert quality control (QC) already applied. Each dataset was modified in several ways: aggregated to coarser time steps, reduced to a single GHI sensor, and shortened to six and three months. The purpose was to quantify how automated QC performance changes with data resolution, record length, and sensor redundancy.
The results show that automation can approach expert performance, but only under favorable conditions.
With multi-sensor, one-minute resolution datasets, automated QC achieved performance close to expert QC. In some cases, automated QC yielded a larger bias/MAE reduction than expert QC, as indicated by the expert/auto ratio.
However, performance degraded when conditions became less favorable.
Single-sensor setups and coarser time steps increased the risk of overflagging and missed issues. Without redundant sensors, automated QC missed more real problems. At P90, the expert-to-automatic ratio could reach up to 2, showing that difficult datasets still require expert review and intervention.
Interestingly, shorter data length was less problematic than expected. Six months of data performed almost identically to one year. Even three months was viable for typical datasets, although consistency decreased on more challenging sites.
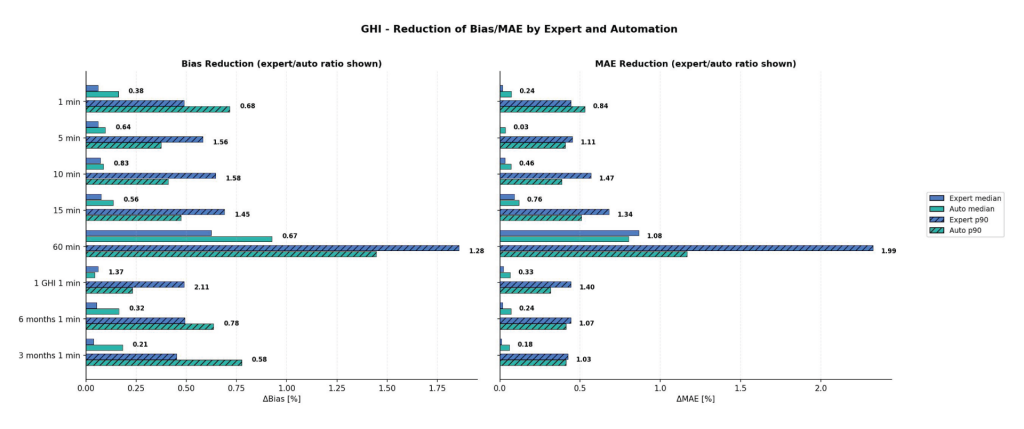
Figure 1: ΔBias and ΔMAE [%] achieved by expert and automated QC relative to the raw measurements, using the Solargis solar resource model as reference, at median and p90. Numbers on bars show the expert/auto ratio - values below 1 indicate automation outperforms expert QC, above 1 the opposite.
The conclusion is that automated QC works best when the measurement setup is strong. Redundant sensors, high temporal resolution, and at least six months of data create much better conditions for reliable automated quality control, as well as for expert assessment.
For high-stakes assessments or difficult sites, automation should complement expert review, not replace it entirely.
Another finding is that not every quality issue has the same impact. Automated QC may miss subtle, low-impact issues but still catch the most important anomalies, keeping bias and MAE reduction close to expert level.
This distinction matters for operational scaling.
For routine data processing, automated QC can be highly valuable if it captures the high-impact problems that materially affect performance analysis. For bankable assessments, expert review remains important because low-frequency or site-specific issues may still influence conclusions, especially when uncertainty margins are tight.
In practice, the best workflow is not manual or automated. It is hybrid.
Automation handles scale. Experts handle context, edge cases, and final judgement.
The third part of our analysis looked at what happens when measurement uncertainty is carried through to PV performance assessment.
The study used one year of five-minute GHI time series with controlled quality issues injected into the data. PVOUT was simulated using Solargis Evaluate for three representative PV configurations: fixed tilt at optimal angle, horizontal north-south tracker, and vertical bifacial single-row. Simulations were performed for three climatically distinct sites.
The key finding is that input data quality directly affects the final performance metric, but the level of impact depends on system design.
For monofacial fixed-tilt and tracker systems, measurement issues in GHI typically propagated into PVOUT with a similar, though slightly reduced, magnitude. Vertical bifacial systems were more sensitive, and in some cases the impact on PVOUT was stronger than the original GHI error.
The practical implication is important: a ±2% GHI bias can translate into approximately ±2% deviation in the Energy Performance Index (EPI). A negative GHI bias can inflate EPI and hide underperformance, while a positive GHI bias can deflate EPI and make a healthy plant appear worse than it is.
This is why quality control must be performed before calculating EPI. An unchecked measurement issue can make a struggling asset appear perfectly healthy on paper.
PV performance evaluation is often used to answer a simple question: is the plant performing as expected? But answering that question depends on the quality of the reference data.
If measured irradiance is wrong, the performance ratio, EPI, model validation, and underperformance analysis can all be distorted. A plant may appear healthy when it is underperforming, or underperforming when the real issue is the measurement reference.
This is why measurement quality control is not just a technical cleaning step. It is part of uncertainty management. The study shows that skipping QC can introduce errors comparable to the broader simulation uncertainty chain.
For PV project teams, there are a 3 key takeaways from our analysis:
Measured data remains essential for PV performance evaluation, site adaptation, model validation, and decision-making. But it should not be treated as automatically correct. Only after proper quality control can it become a reliable foundation for lower uncertainty and more trustworthy performance assessment.