Join our upcoming webinar "Can you rely on measured data?" on October 27, 2026 at 10:00 AM CET. Register here
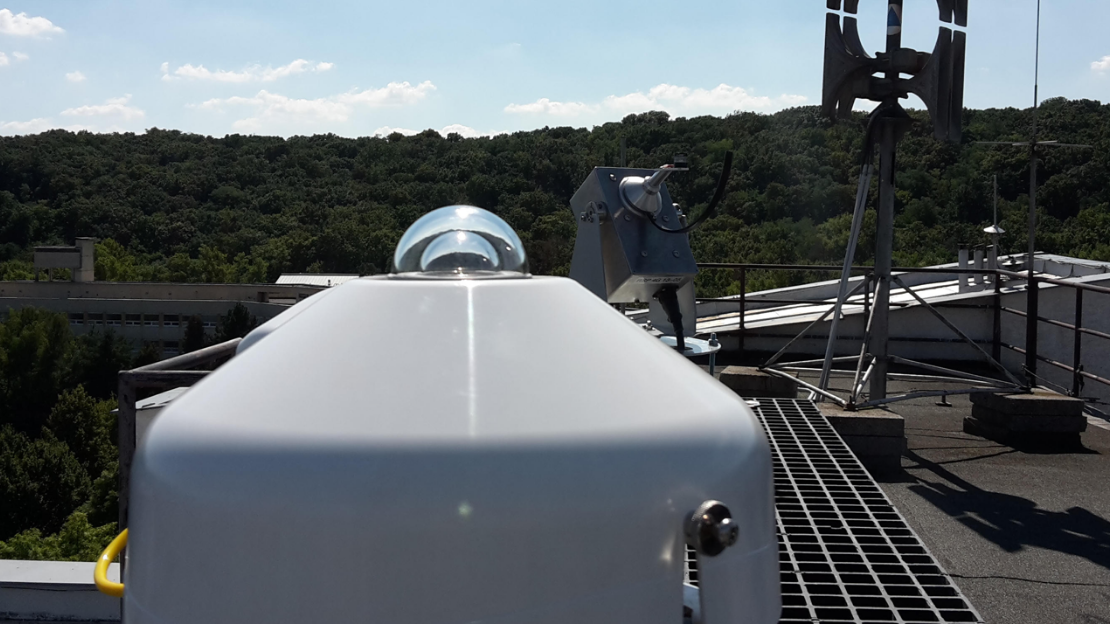
Ground-measured solar data is often treated as the ground truth. It is used to evaluate PV plant performance, validate models, adapt satellite-based datasets to local conditions, calculate expected production, and assess whether an asset is performing as it should. But measured data is never perfect. Instrument faults, installation issues, environmental effects, soiling, shading, calibration drift, and sensor misalignment can all introduce errors.
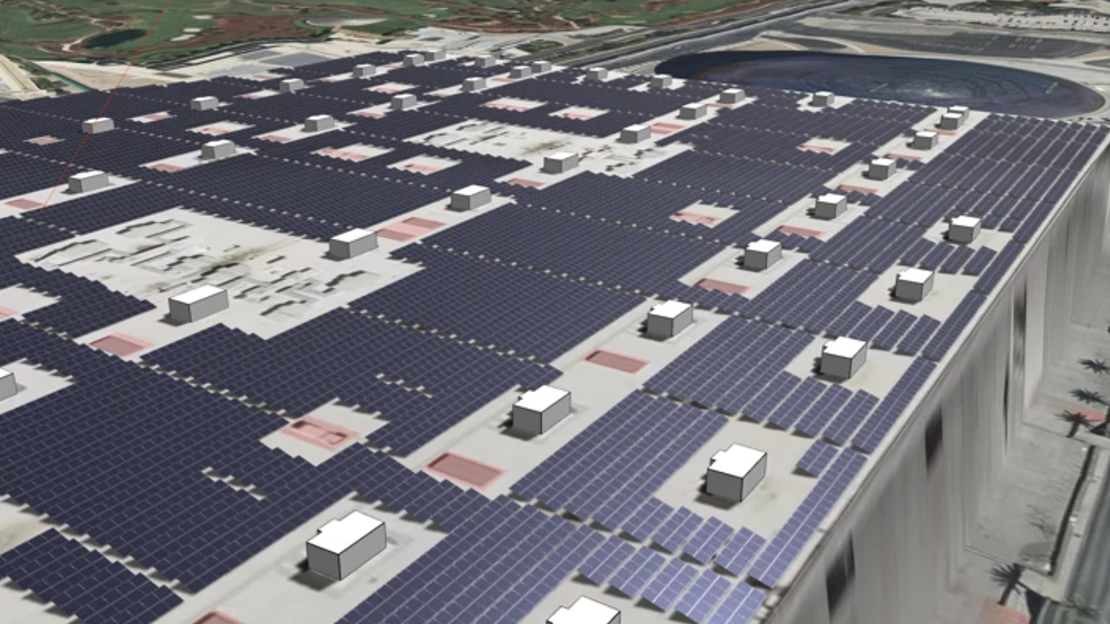
Solargis Evaluate now supports C&I rooftop design, simple and terrain-aware backtracking, and CAD-ready layout export. Learn about the most important updates from releases 2.8 and 2.9, including new hail and soiling layers in Solargis Prospect.
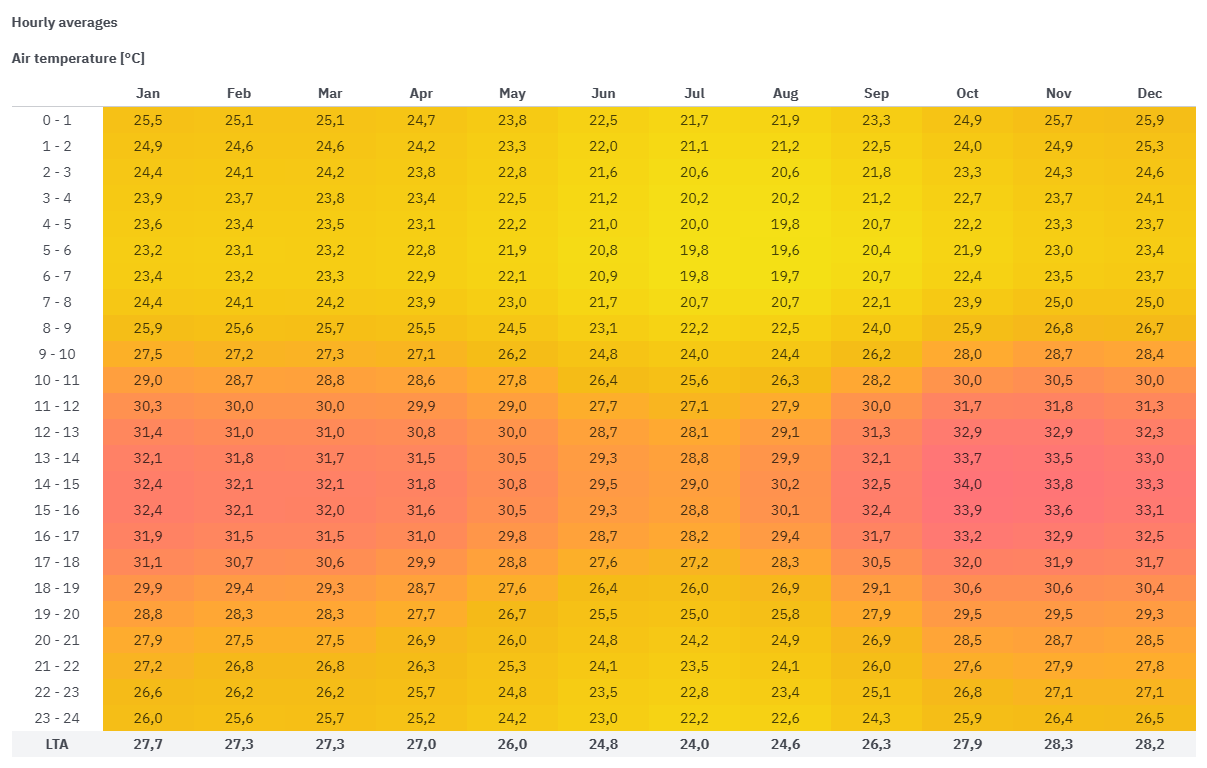
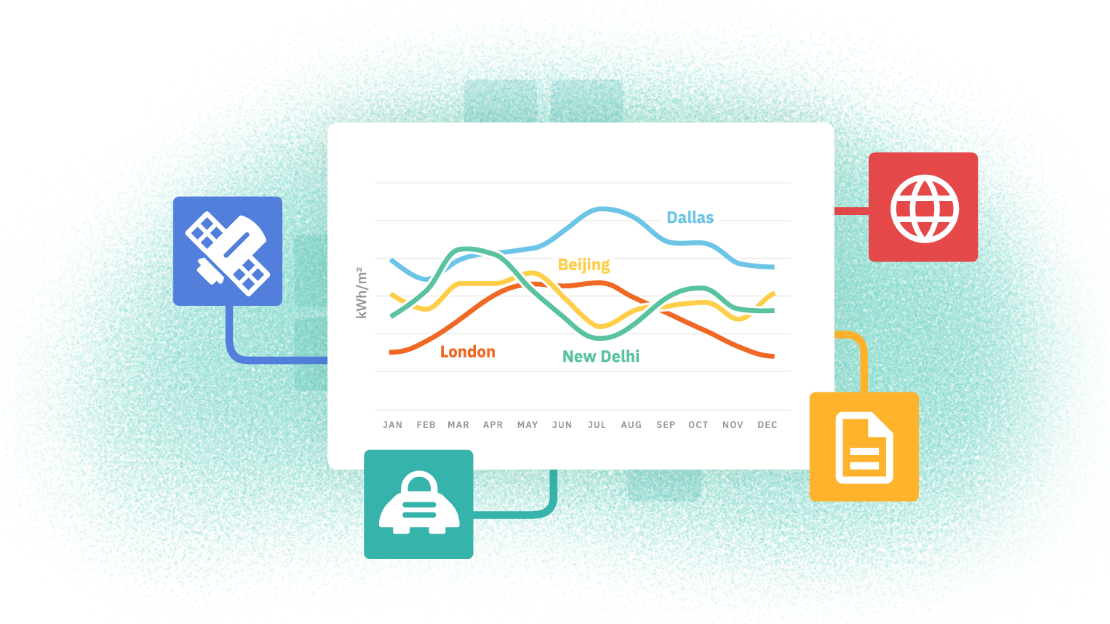
Do your simulations account for the actual temperature conditions at your PV plant site? If you use Typical Meteorological Year (TMY) datasets as inputs, the short answer is “not really.” By analyzing both Solargis time series and Solargis TMY data for a sample site, we show how TMY data can fail to capture high temperatures over the long term, potentially creating unnecessary risks for PV projects.
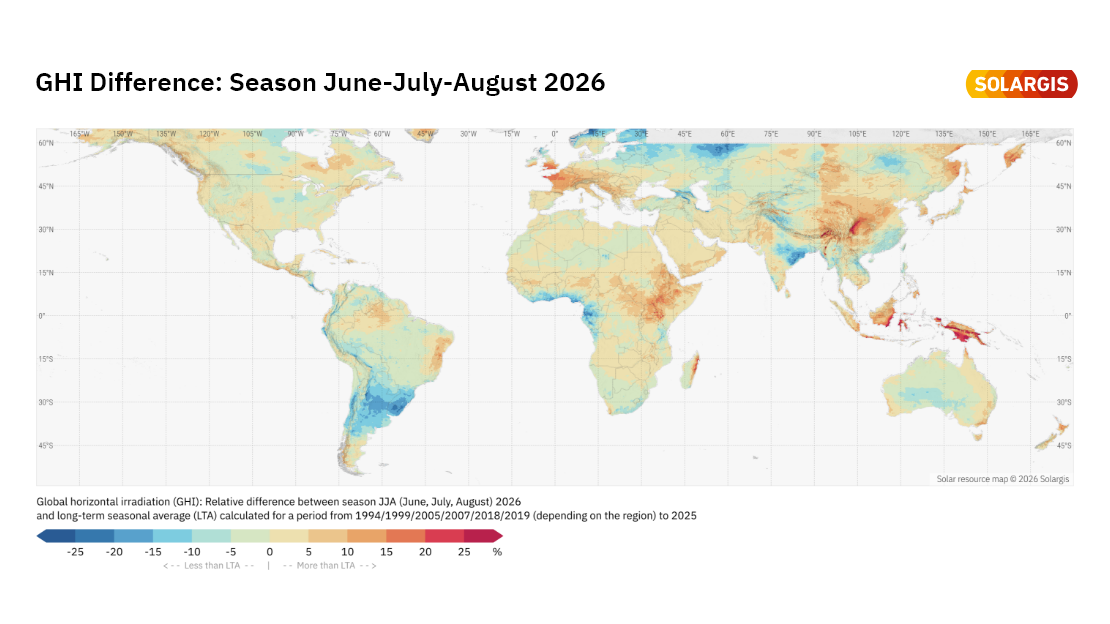
The June–July–August 2026 season brought several notable regional extremes in solar irradiation, temperature, and precipitation. These contrasts are clearly visible in the Solargis difference maps, which compare the aggregated JJA 2026 season with long-term averages (LTA). Let’s take a closer look at the maps, see where this season deviated from normal conditions, and explore why these deviations matter for PV asset performance, reporting, and planning.
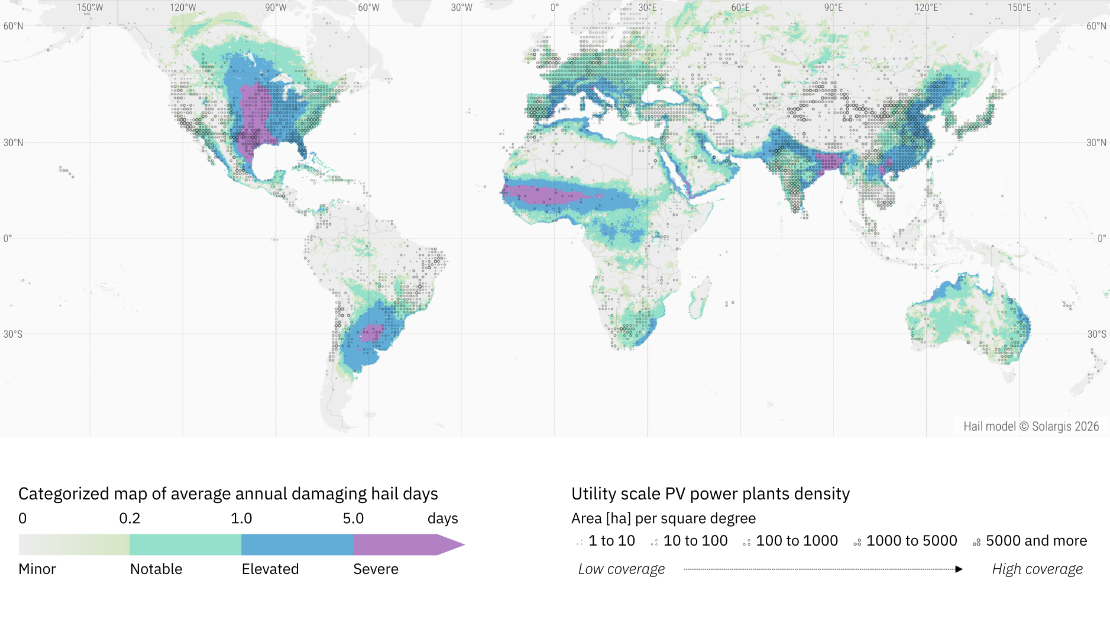
Solargis Prospect now features a global hail risk map, highlighting regions with recurrent atmospheric environments prone to damaging hail. Rather than event-level prediction, it is designed for long-term risk assessment. Understanding these long-term hail patterns is essential for making informed investment, design, and insurance decisions.
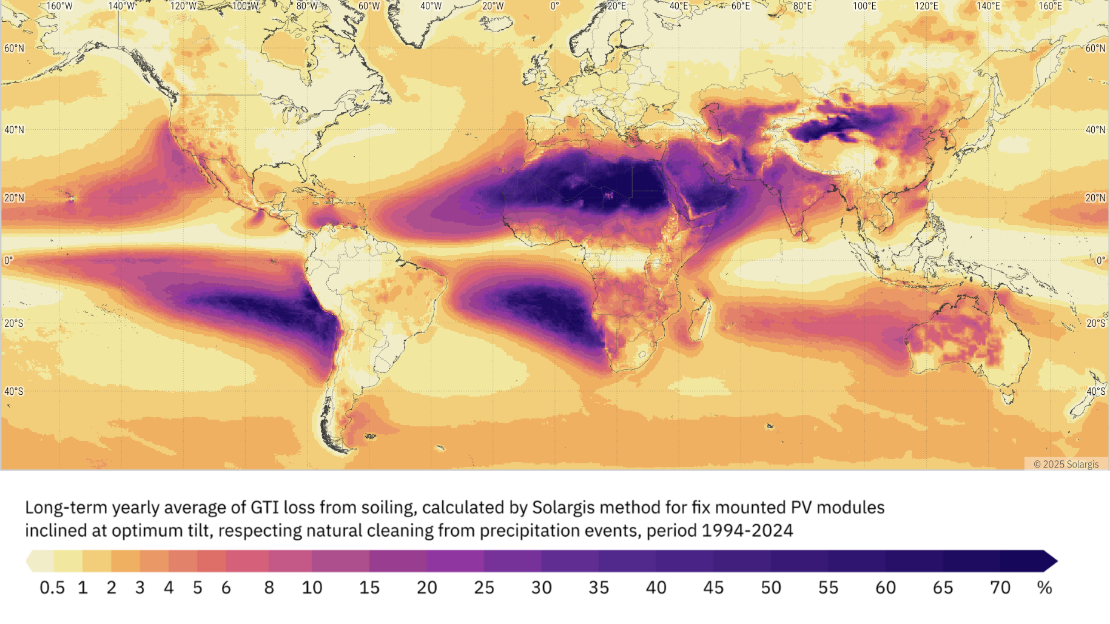
Soiling has a great impact on PV performance. Dust, dirt, pollen, industrial pollutants, or sea salt obstruct PV modules and reduce solar irradiance transmission, leading to energy losses and higher operational costs. Global soiling maps, now available in Solargis Prospect, give priceless insight into soiling patterns around the world and help PV operators make necessary steps for minimizing their impact.
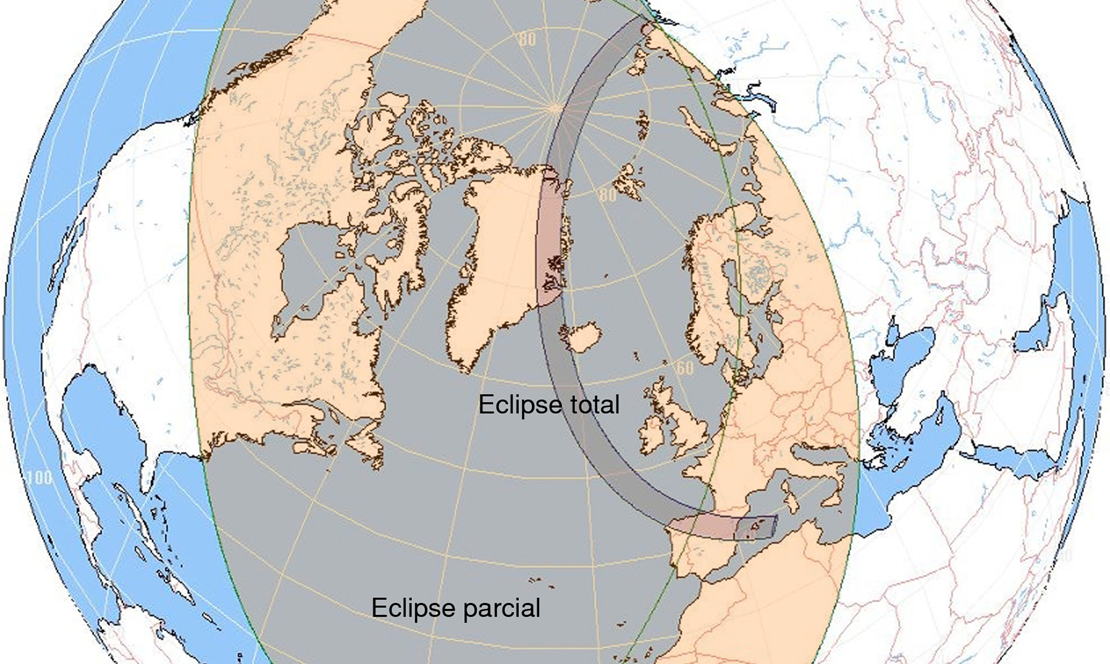
Weather anomalies and extreme events are constantly challenging the results of regular performance reporting on PV assets around the world. This summer, wildfires and heatwaves are affecting large areas of Europe. On top of that, a total solar eclipse, set to happen in just a few days, deserves attention too.
Terrain is a critical input for energy simulations as it dictates the geometric and physical reality of a power plant's performance. Since utility-scale PV projects are often built on complex terrain, not perfectly flat plots of land, taking into account specific terrain features such slopes, hills, valleys or ridges is a key factor for ensuring the accuracy of PV simulations and subsequent energy yield estimates.
Depending on location and conditions, satellite-based solar resource data typically have uncertainty in the range of about 4–8%. With high-quality ground measurements and proper site adaptation, that uncertainty can often be reduced to around 3–5%. This reduction may look small but it is commercially meaningful for many utility-scale PV projects.
We’ve just added another layer of precision to Solargis Evaluate. Following the recent launch of snow loss calculations, soiling losses are now also part of our energy yield simulation toolkit – helping developers, investors, and technical advisors model real-world PV performance more accurately.
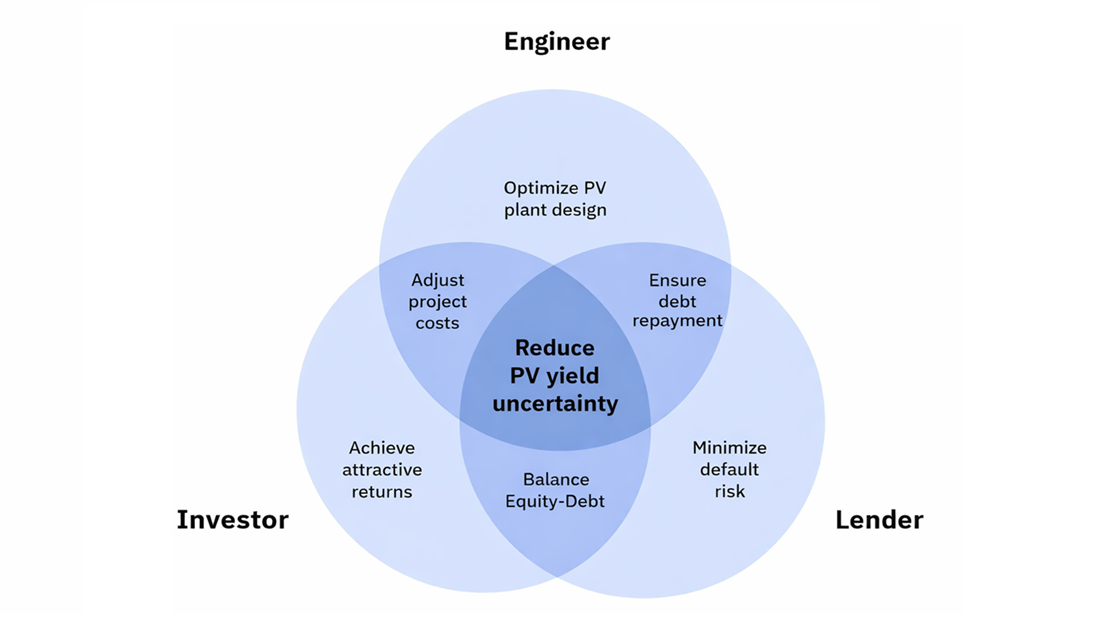
Every solar PV project usually starts with one simple number: expected annual PV yield. At first glance, this number looks clear and precise. In reality, however, it always comes with uncertainty. How a project team deals with this uncertainty matters a lot. It influences engineering design, investor expectations, and bank financing, often in ways that only become visible late in the project lifecycle.
Approximately one year ago, we launched Solargis Evaluate packed with features for complex site assessment, PV system design, energy yield simulation, analysis, and reporting, all under one roof. Our latest Evaluate 2.7 release is introducing major improvements in the PV system designer, data analysis, and bankable reports. Get to know the latest feature updates.
Solargis Prospect and Solargis Evaluate are essential in the pre-feasibility and feasibility phases, but they serve different purposes. Many of our customers ask how the two products differ, how they fit into the project development process, and whether – or when – to transition from Prospect to Evaluate. In the article, we'll walk you through the role of each solution and help you make the right product decision.