本页未翻译。您正在浏览的是英文版本。
Surface solar radiation (SSR), or, in other words, global horizontal irradiance (GHI), is a scientific term for sunlight that reaches the ground. Understanding how SSR changes over time is essential not only for meteorology and climatology but also for the long-term planning and profitability of photovoltaic (PV) projects.
A new peer-reviewed study, conducted by researchers from the University of Murcia and the University of Málaga in collaboration with Solargis experts and powered by Solargis data, evaluates past and projected surface solar radiation (SSR) trends across Europe from 1994 to 2054.
To date, the study is one of the most comprehensive assessments of solar trends in Europe, factors that are driving these changes, and what we might expect in the upcoming future. The study focuses on the impact of clouds and aerosols, as they have been identified as the two main drivers of long-term trends in SSR.
The analysis draws on a comprehensive set of ground-site observations, five historical gridded datasets, and an ensemble of 30 CMIP6 climate models spanning four forcing scenarios. Together, these sources provide a seamless, unprecedented characterization of how SSR is changing across Europe over time and space.
The study has also been covered by media such as The Times, The Independent, PV Magazine, or El Periodico de la Energia.
Observations from 1994–2023 show an increase of 3.1 W/m² per decade (the mean Solargis SSR value during that 30-year period was 143 W/m2), with the strongest growth occurring in the last ten years. Typical annual average SSR levels across Europe range roughly from ~100 W/m² in northern areas to around ~200 W/m² in southern locations.
With proper tuning, satellite-based models can monitor the long-term increase of surface solar radiation. All four satellite-based models evaluated in the study agree with the observations within 土0.3 W/m2 per decade.
Most climate models project surface solar radiation changes in 2024-2054 smaller than 1 W/m2 per decade in all four different emission scenarios that are analyzed.
This long-term reduction in atmospheric aerosols is contributing significantly to less cloudy and clearer skies and so also to higher solar radiation reaching the surface.
From a PV industry perspective, the study offers several clear implications.
First, Europe has seen a multidecadal increase in available solar resource that is both measurable and scientifically robust. The clarity of observation of these trends has virtually proven that there is indeed a climate change-related alteration of the long term averages in the European solar resource availability.
Another significant outcome from the study is that ECMWF’s ERA5 and climate models such as those from CMIP6 are not suitable for monitoring long term SSR trends as we have seen that they largely disagree with the observed trends in ground stations.
Conversely, properly tuned satellite-based datasets, like Solargis, provide an accurate and spatially coherent means of quantifying them.
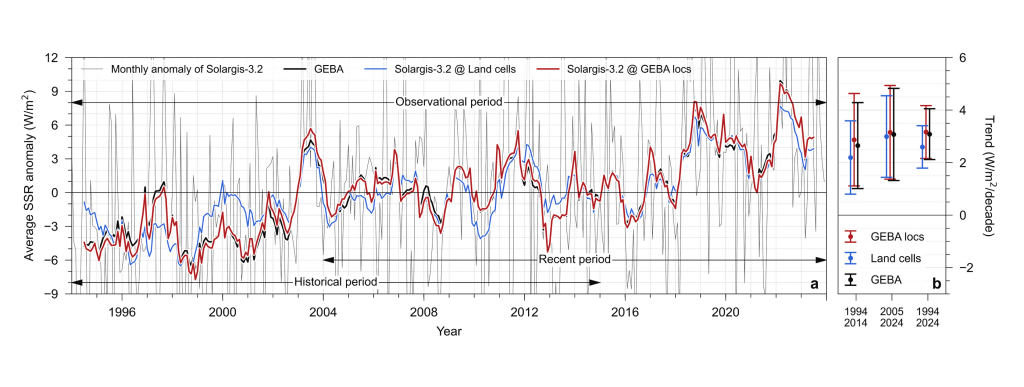
Fig. 1. 12-month running means of (a) regional SSR mean anomalies in the GEBA locations and the land cells of Solargis-3.2 and (b) the SSR trends and confidence interval evaluated from GEBA observations (black) and Solargis-3.2 (red in the GEBA locations, and blue in all land areas) for the Historical, Recent and Observational periods. The vertical bars in panel b are the confidence intervals at the 95% confidence level. (For interpretation of the references to colour in this figure legend, the reader is referred to the web version of this article.)
While climate models provide the only means of projecting SSR decades into the future, their results must be interpreted cautiously, as their outcomes for 1994-2014 have shown both to underestimate the magnitude and to misaccount for the cloud-related origins of observed SSR trends.
Overall, the findings reinforce the importance of relying on multi-source, quality-controlled datasets to understand past and future solar resource availability. For developers, investors, and policymakers, such insights are essential for ensuring that PV planning and decision-making are grounded in a scientifically validated understanding of Europe’s evolving solar climate.
Below, we explore each of these points in more detail.
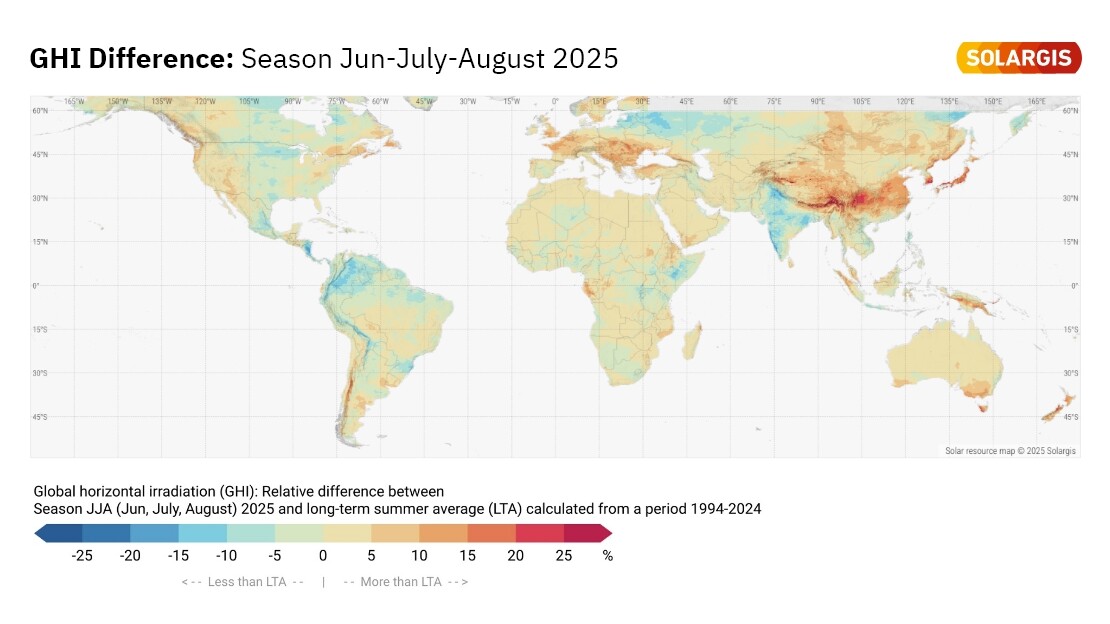
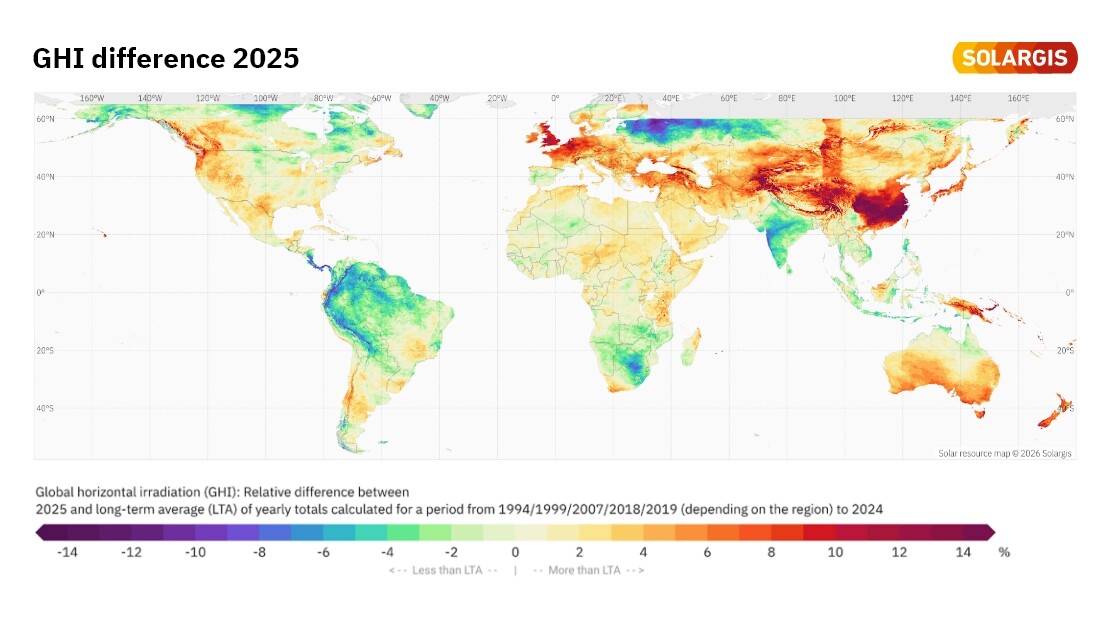
Solar resource has been analysed since 1994, when the era of modern satellite records of solar irradiance began. Over this period, most of Europe has experienced a significant increase in surface solar radiation (SSR), with an average trend of 3.1 W/m² per decade between 1994 and 2023. Over a thirty-year span, this represents a meaningful rise in the available solar resource. For the PV sector, these changes can translate into a non-negligible enhancement of long-term energy yield, particularly in regions where the trend is strongest.
To put this trend into context, it is useful to relate it to typical long-term average values of solar resource. When expressed as an annual mean irradiance, GHI in Europe typically ranges from about 100 W/m² in northern regions such as Scotland to around 200 W/m² in southern locations such as southern Spain. A recorded trend of approximately 3 W/m² per decade therefore corresponds to a change of a few percent per decade relative to these baseline values, which is quite significant. However, it is also important to note that this trend is not expected to continue indefinitely at the same rate and is likely to culminate at some point in the near future.
Note: In Solargis Prospect and in most energy-sector applications, solar resource is usually expressed in kWh/m²/year rather than W/m². The conversion between the two is straightforward:
W/m² (year-average) = GHI_Prospect (kWh/m²/year) ÷ 365 ÷ 24
In other words, dividing the annual GHI (in kWh/m²/year) by 8,760 hours converts it to an equivalent average power in W/m². This helps bridge the gap between the way trends are reported in the climatology domain (W/m²/decade) and how PV engineers and developers are used to thinking about resource (kWh/m²/year).
While the continental-scale trend is unmistakably positive, its spatial distribution is diverse. The strongest increases in SSR occur across central Europe, particularly northeastern France, the Benelux region, and western Germany. Additional areas, including Great Britain, Scandinavia, the Italian Peninsula, and the Balkans, also show a clear increase of solar radiation, but to a lesser extent. In contrast, isolated parts of the Iberian Peninsula and eastern Europe exhibit stable or even slightly declining SSR in recent years, highlighting the importance of spatially resolved datasets for regional PV planning. Still, when aggregated at the European scale, all datasets confirm a coherent, statistically significant rise of solar radiation across the continent.
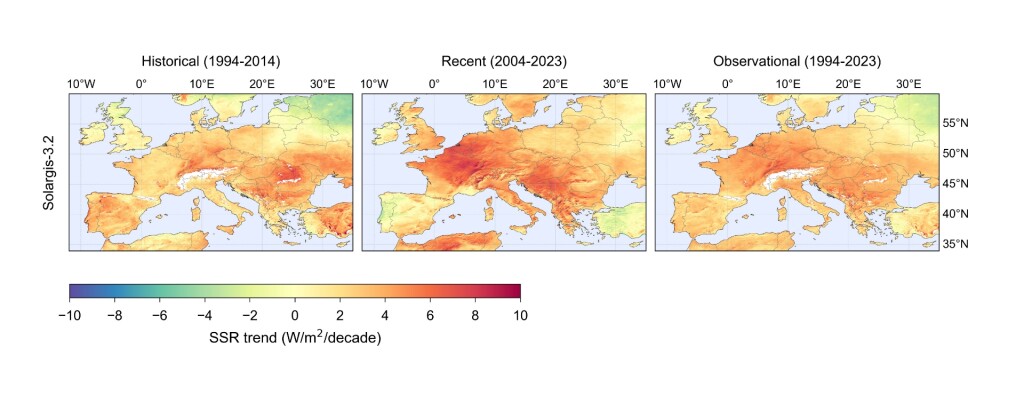
Figure 2.: Solargis SSR trend maps for Europe during three different periods (historical, recent and observational). The main mountainous areas for the historical and observational periods are excluded because they span data with both Meteosat First and Second Generation satellites, which are not compatible for the evaluation of SSR trends in mountainous regions. Image adapted from Segado-Moreno et al. (2025).
Aerosols have a twofold impact on SSR. First, in cloudless areas they are the main atmospheric constituent depleting solar radiation (aerosol direct effect, ADE), also contributing to alter the heating and cooling of the atmosphere and cloud thermodynamics (aerosol semidirect effect). Second, in cloudy areas they alter cloud processes affecting their formation, dissipation and optical properties through mechanisms such as the Twomey and Albrecht effects (jointly referred to as aerosol indirect effect, AIE).
While aerosols and clouds have long been identified as the two key factors influencing the long term SSR trend, their relative contributions remain unclear.
By using a column version of the Solargis model and comparing simulations based on daily aerosol optical depth inputs versus long-term aerosol climatologies, the authors of the study were able to isolate the aerosol direct effect, which is estimated to account for ≈20% of the observed SSR increase since 1994.
The remaining ≈80% of the trend is linked to cloud-related processes, which include both aerosol/cloud interactions (Twomey and Albrecht effects) and changes in cloud coverage possibly associated with rising air temperatures. The study shows that aerosol-induced changes in cloud albedo alone cannot explain the observed SSR trend; instead, decreasing cloud fraction plays a comparably important role. The analysis suggests that, over the full 1994–2023 period, the increased solar radiation can be interpreted approximately as 20% ADE, 40% first AIE, and 40% cloud-fraction changes, although these values may shift depending on uncertainties in current gridded aerosol datasets.
Still, the overarching conclusion is robust: cloud changes, partly induced by aerosol changes, are twice as influential as aerosol direct effects in shaping Europe’s long-term SSR trend.
The study employed a multi-source approach to create a robust characterization of SSR trends across time and space. The analysis integrated three primary data types:
Ground Observations: Data from a network of 46 quality-checked and homogenized ground stations (from the GEBA/WRDC archives) provided reliable, high-precision point measurements. The used ground observations passed stringent quality assurance checks to exclude inhomogeneous site data, which would otherwise lead to incorrect observed trends.
Gridded Datasets: Five historical datasets, including four satellite-based models (Solargis-3.2, SARAH-3, CLARA-A3, CEBAF-4.2.1) and the ERA5 reanalysis, were used to analyze temporal and, chiefly, spatial patterns, thanks to their coverage of almost the whole continent. To ensure temporal stability of the gridded data, it was compared to the ground observations, and bias and root mean square deviation were quantified. The Solargis dataset was benchmarked and found to be a top performer.
Climate Projections: An ensemble of 30 CMIP6 climate models, involving nearly 300 climate change projections, was used to analyze historical simulations (1994-2014) and project future trends (2024-2054) under four different forcing scenarios (SSP1-2.6 to SSP5-8.5).